EU27 Ferrous Scrap Exports: TüRkiye's Share and the Rise of Egypt
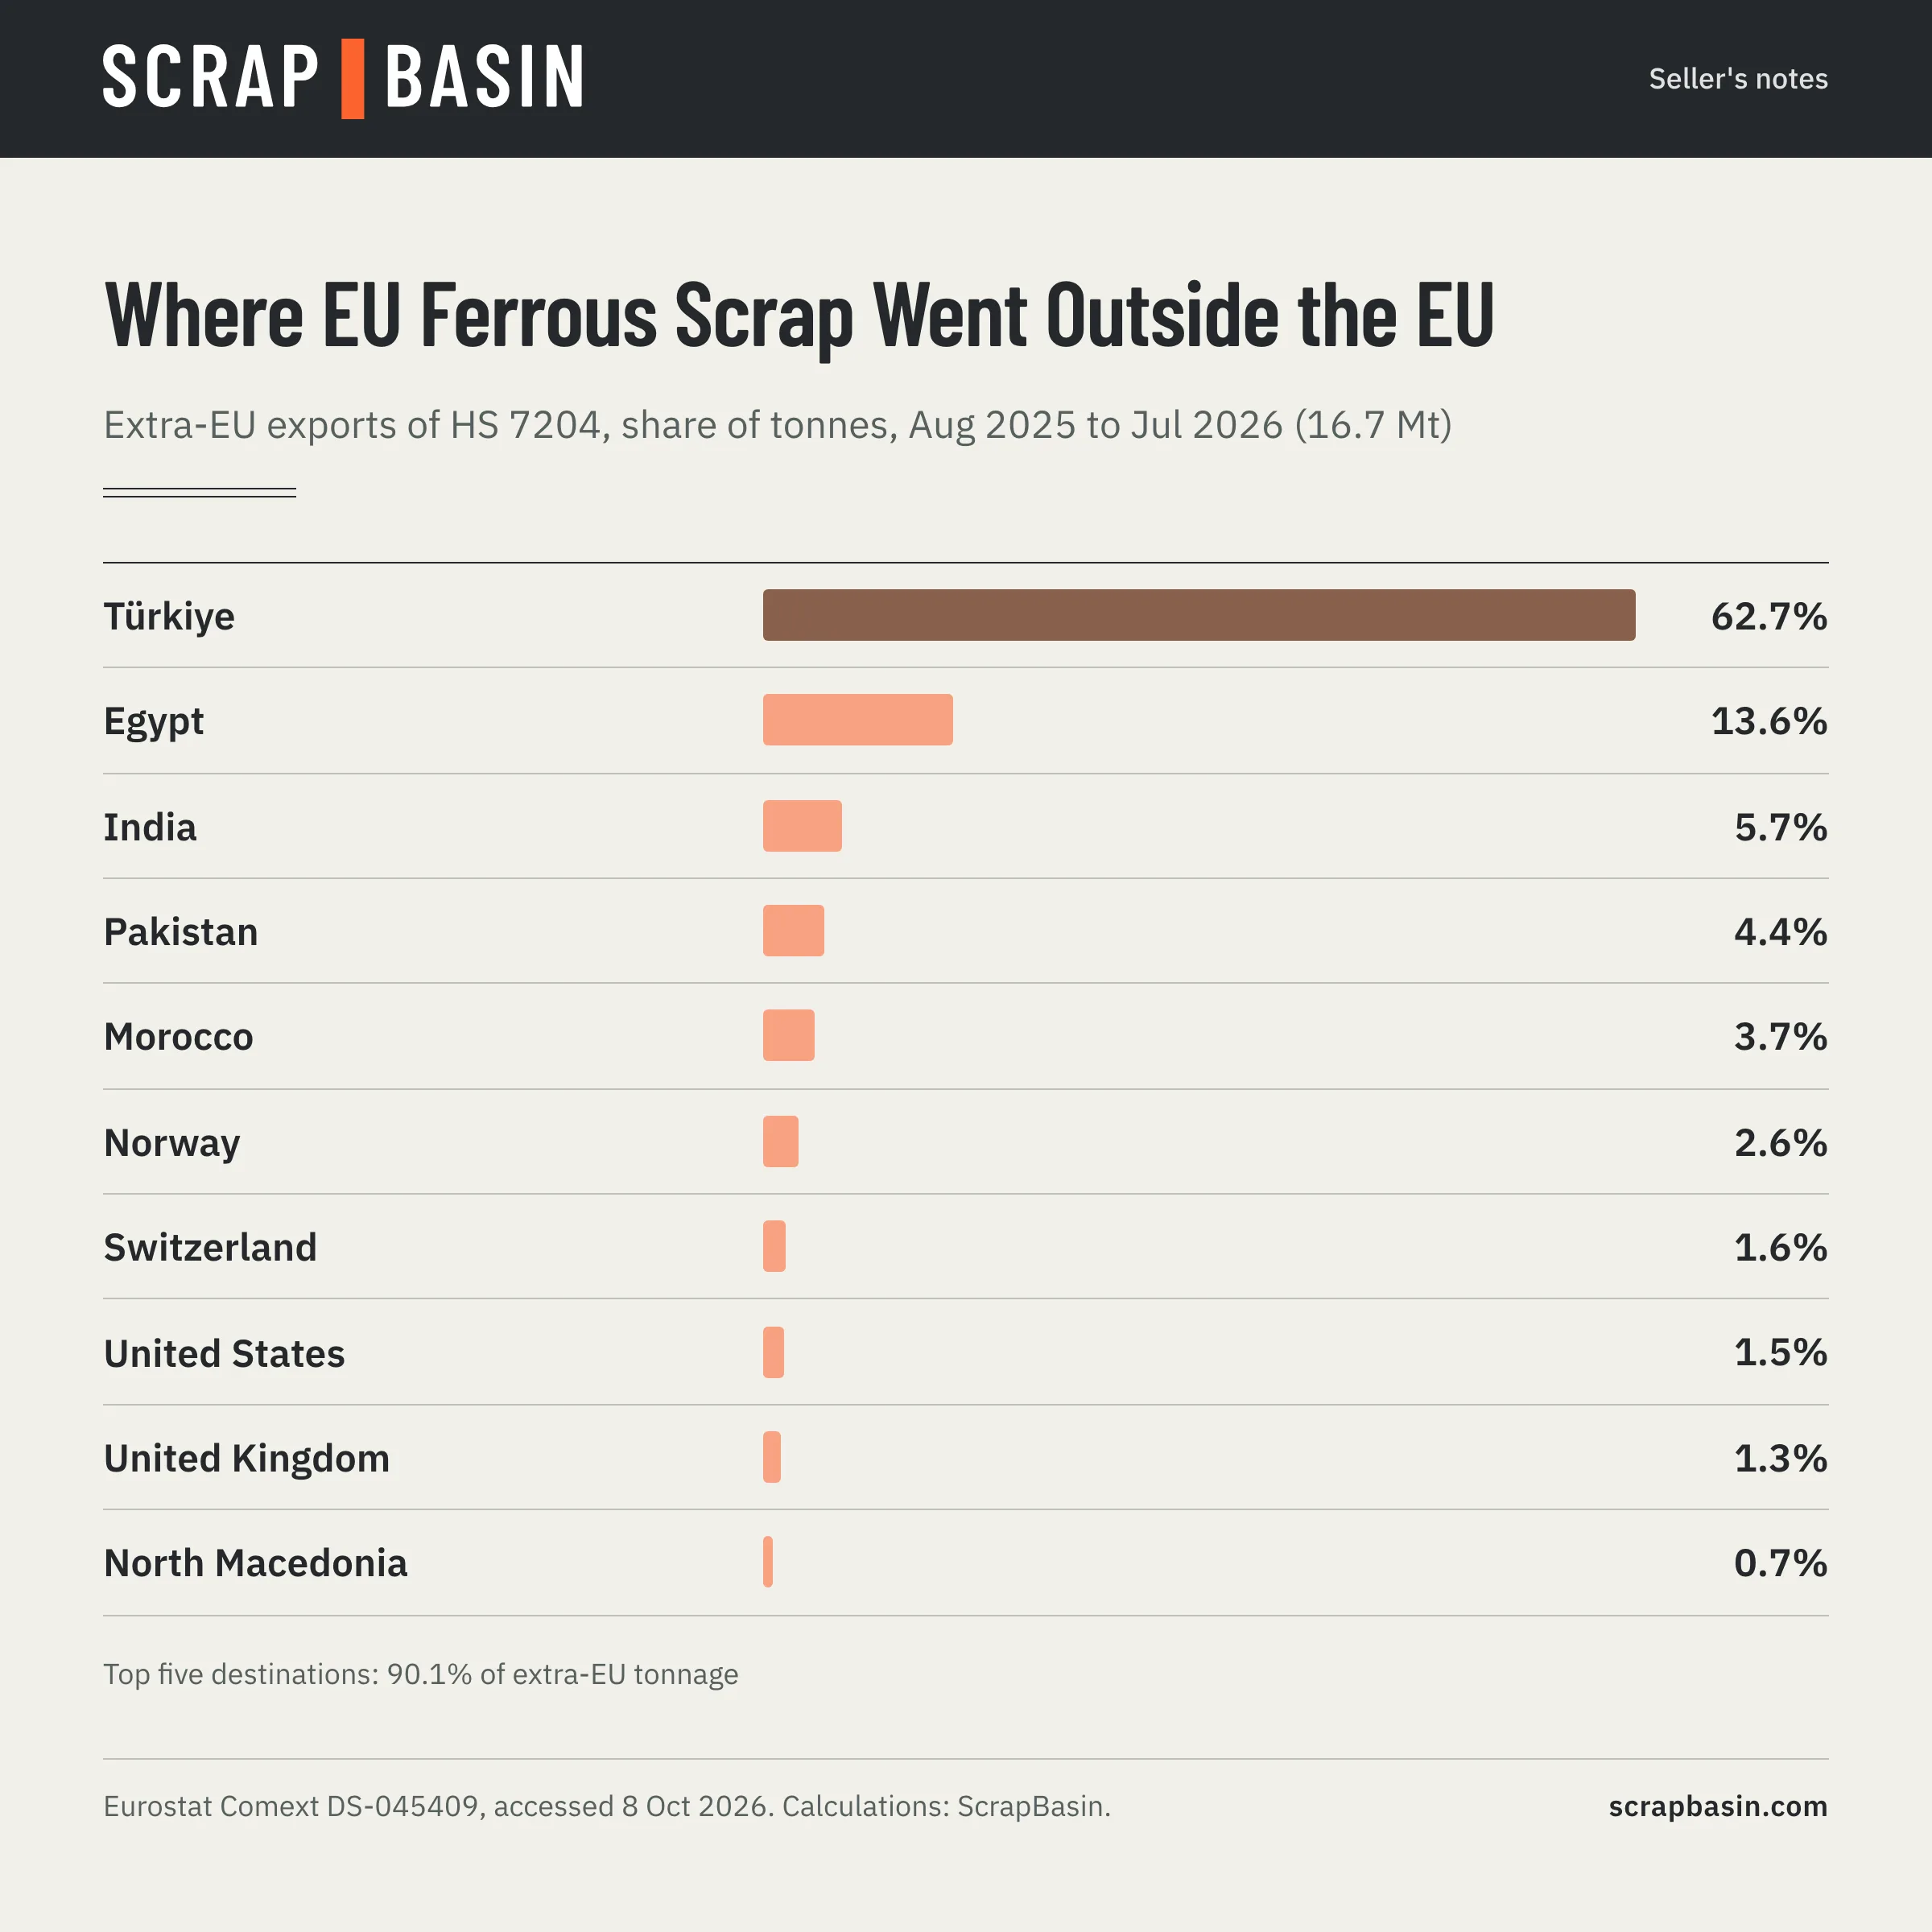
EU27 ferrous scrap exports outside the EU, Aug 2025 to Jul 2026, from Eurostat: 16.7 Mt, Türkiye 62.7% (down from 66.7%), Egypt up 85%.
Contents 7
Türkiye is the single largest buyer of European ferrous scrap, and anyone selling, trading or analysing scrap in Europe or the UK watches its demand. This note uses Eurostat's trade database, pulled on 8 October 2026, to measure how much of the EU's ferrous scrap exports outside the EU went to Türkiye in the twelve months to July 2026, how that compares with the year before, and which other destinations are growing. It ends with what the EU's 2027 export rules mean for these flows.
In short
- EU27 countries exported 16.7 million tonnes of ferrous (iron and steel) waste and scrap (HS 7204, the customs heading for ferrous scrap) to countries outside the EU between August 2025 and July 2026, 8.8% more than a year earlier.
- Türkiye took 10.47 million tonnes, 62.7%, down from 66.7%. Its tonnage still rose 2.2%.
- Egypt almost doubled its intake (+85.1%) to 2.27 million tonnes, 13.6% of extra-EU exports. Pakistan (+28.8%) and Morocco (+60.2%) also grew; India fell 11.5%.
- The five largest destinations took 90.1% of extra-EU tonnage.
- Extra-EU exports were 40.4% of all EU27 ferrous scrap exports; the rest moved between Member States.
- About 30.2% of extra-EU tonnage went to destinations outside the OECD (the Organisation for Economic Co-operation and Development, a group of mostly high-income countries), the part exposed to the EU's export rules from 21 May 2027.
Destinations Outside the EU
| Rank | Destination | Tonnes | Share | Share a year earlier | Change in tonnes | Declared EUR per tonne |
|---|---|---|---|---|---|---|
| 1 | Türkiye | 10,465,501 | 62.7% | 66.7% | +2.2% | 300 |
| 2 | Egypt | 2,272,033 | 13.6% | 8.0% | +85.1% | 290 |
| 3 | India | 950,672 | 5.7% | 7.0% | minus 11.5% | 579 |
| 4 | Pakistan | 740,503 | 4.4% | 3.7% | +28.8% | 556 |
| 5 | Morocco | 613,695 | 3.7% | 2.5% | +60.2% | 298 |
| 6 | Norway | 428,257 | 2.6% | 3.1% | minus 10.2% | 263 |
| 7 | Switzerland | 268,201 | 1.6% | 2.4% | minus 28.4% | 305 |
| 8 | United States | 258,556 | 1.5% | 1.7% | minus 0.4% | 355 |
| 9 | United Kingdom | 224,755 | 1.3% | 1.5% | minus 5.5% | 379 |
| 10 | North Macedonia | 115,100 | 0.7% | 0.9% | minus 16.4% | 313 |
The higher declared values for India and Pakistan (above EUR 550 per tonne against about EUR 300 for Türkiye and Egypt) most likely reflect a different product mix, with more processed or alloy-bearing material, rather than a higher price for the same grade.
TüRkiye: More Tonnes, Smaller Share
Türkiye's share of extra-EU exports fell four points over the year, but not because it bought less: its tonnage rose 2.2%. The share fell because the total grew faster, led by Egypt.
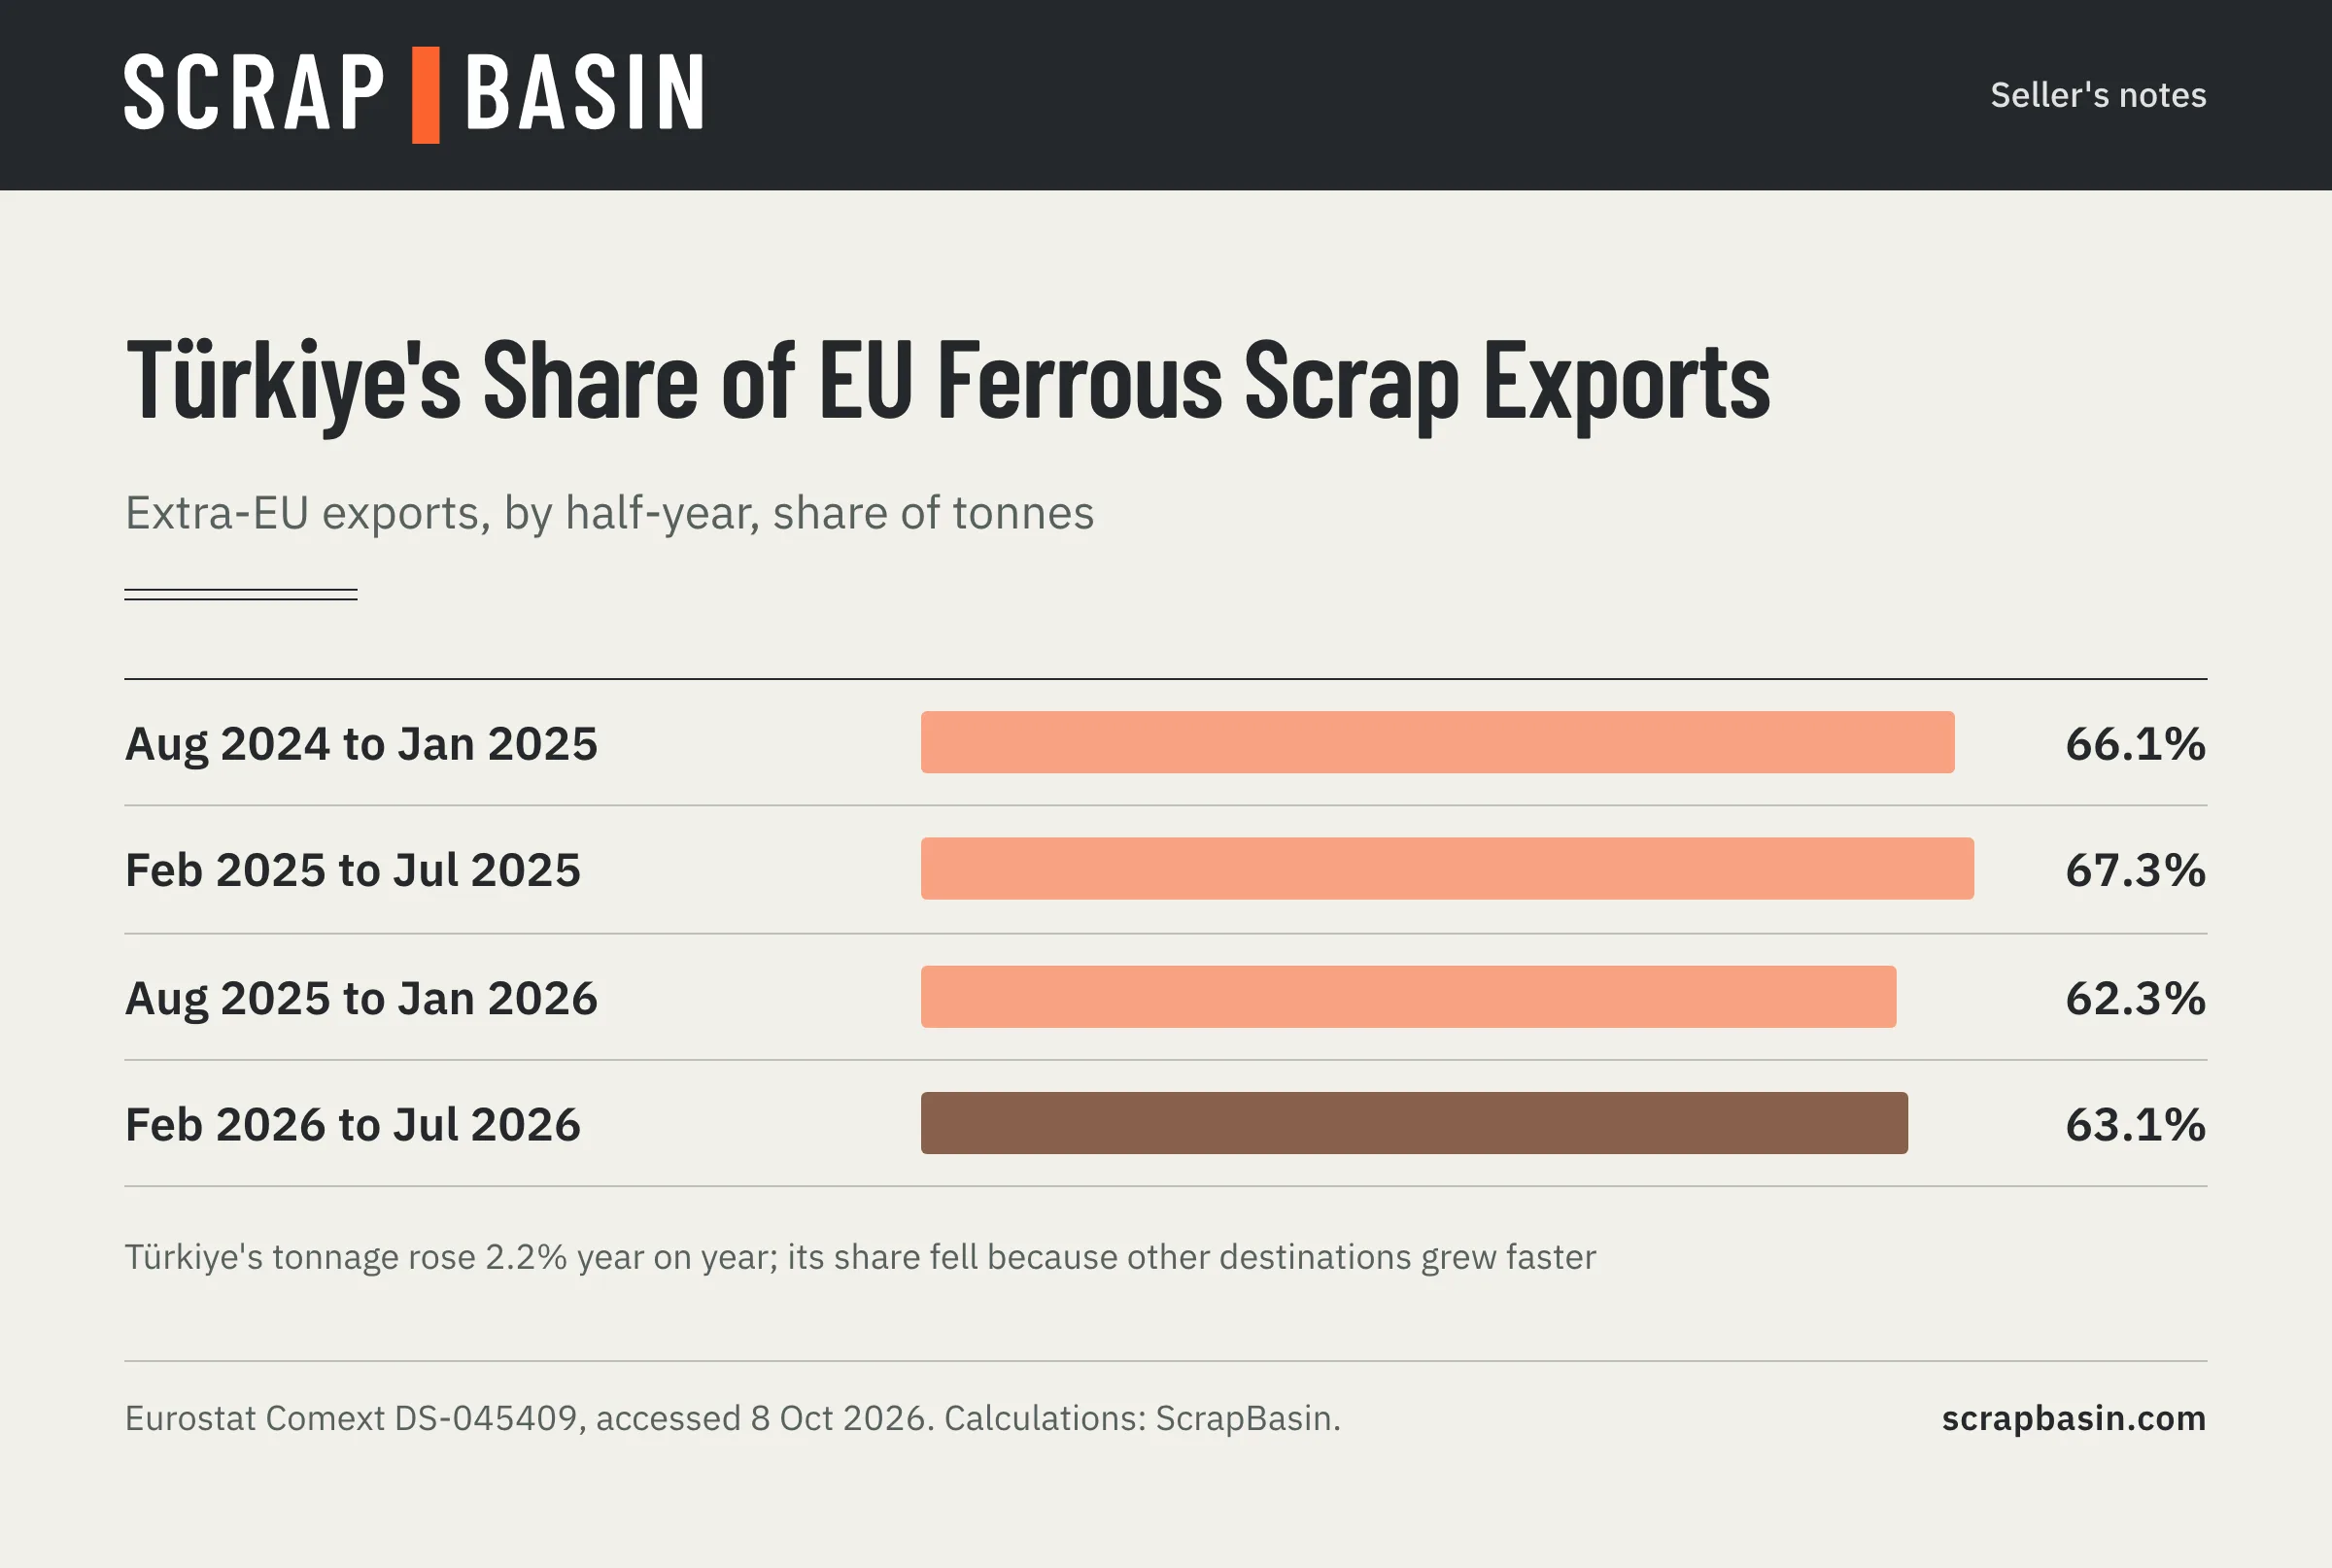
Month to month the share swings widely: between 53.3% (November 2025) and 72.1% (December 2025) in the latest twelve months, and as high as 78.8% in April 2025. Single months reflect cargo timing; the half-year figures above are the steadier read.
Egypt and the North African Shift
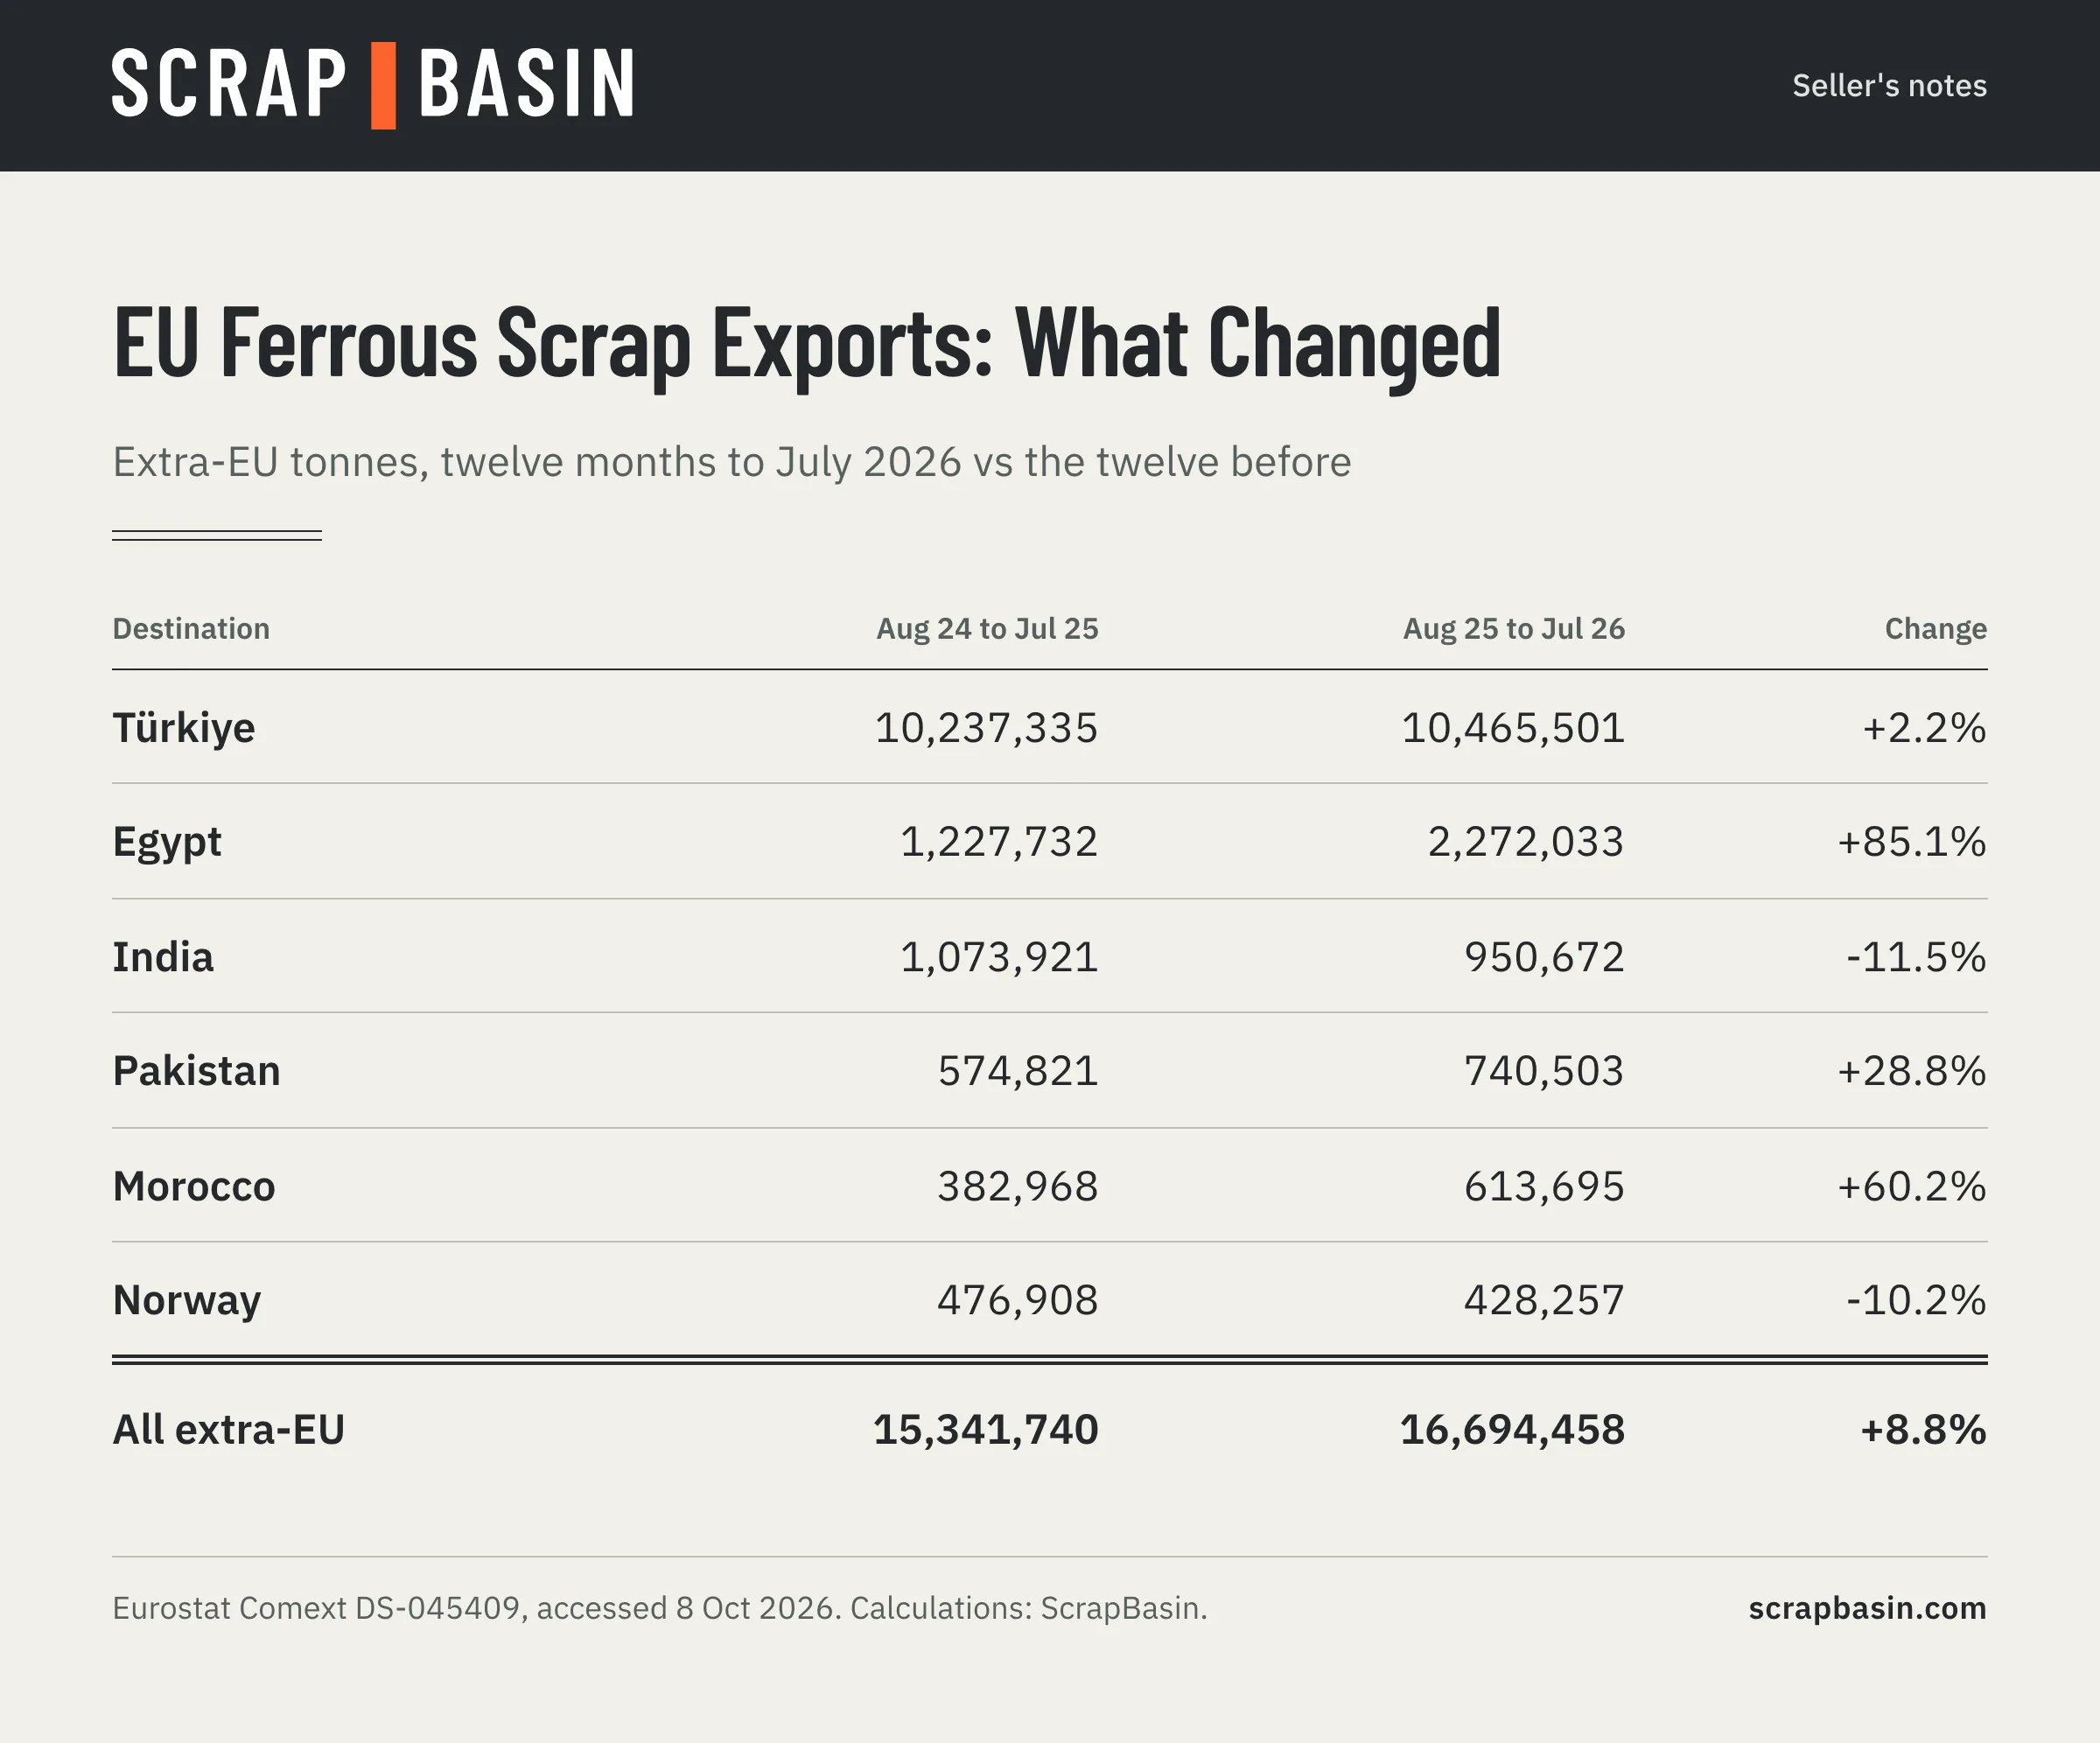
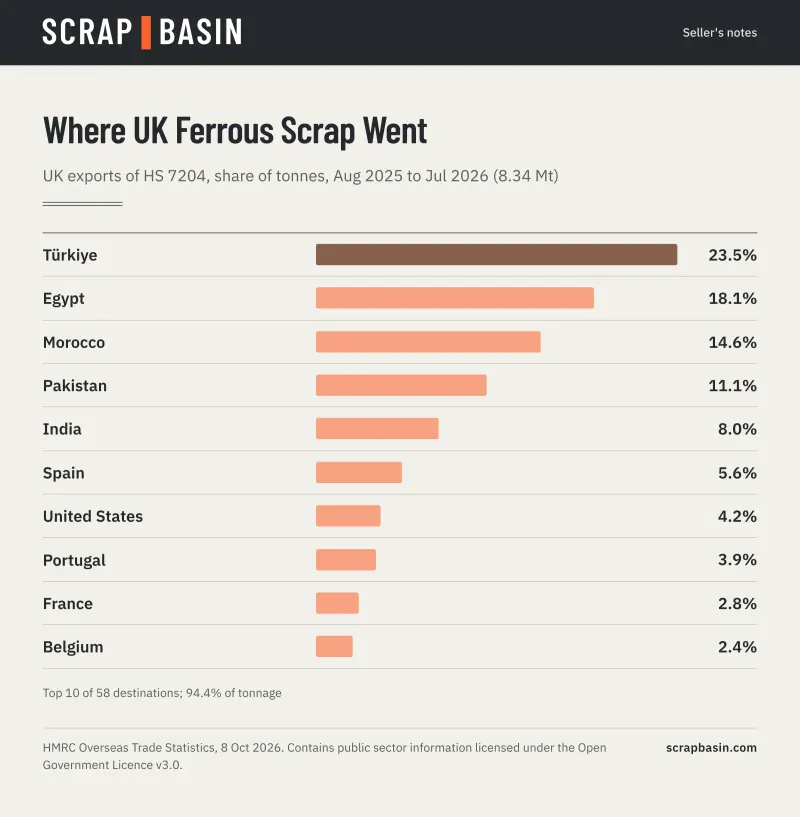
Egypt added just over a million tonnes in a year, from 1.23 million to 2.27 million. Morocco added 231,000 tonnes. The same pattern shows in UK data: Egypt and Morocco together grew by about a third as destinations for UK ferrous scrap over the same period, while Türkiye's share of UK exports also fell (see our note on UK ferrous scrap exports). Türkiye takes a much larger share of EU exports (62.7%) than of UK exports (23.5%).
Value
The average declared value of extra-EU ferrous scrap exports was EUR 332 per tonne over the twelve months, against EUR 353 a year earlier. Monthly, it fell to EUR 296 in December 2025 and then rose to EUR 381 in June 2026, before EUR 364 in July. These are customs unit values (declared value divided by net mass for the whole heading), affected by mix and delivery terms. They show direction, not price.
What the 2027 Rules Mean for These Flows
From 21 May 2027, the EU's Waste Shipment Regulation prohibits exports of green-listed waste, which includes clean metal scrap, to countries outside the OECD, unless the Commission lists the country for that waste. Türkiye is an OECD member, so the largest flow continues under the existing green-list procedure, with Commission monitoring. Egypt, India, Pakistan and Morocco are not OECD members: together with smaller destinations, about 30.2% of extra-EU ferrous scrap tonnage went to non-OECD countries in the latest twelve months. Whether those flows continue depends on the Commission's list, due by 21 November 2026. See our guide to the EU Waste Shipment Regulation, and for aluminium, where the exposure is much larger, the EU aluminium scrap exports tracker.
Method and Reuse
- Source: Eurostat Comext dataset DS-045409 (EU trade since 1988 by HS2-4-6 and CN8), API queried 8 October 2026 without a key; dataset last updated 15 September 2026; latest month July 2026.
- Query: reporter EU27_2020 (the EU aggregate), product 7204, flow export, all partners, monthly, August 2024 to July 2026, value in euros and quantity in 100 kg (divided by 10 for tonnes). We publish the exact query and the extract with the note.
- Processing: extra-EU totals from the EXT_EU27_2020 aggregate; partner shares calculated against that aggregate; OECD grouping by ScrapBasin.
- Limits: customs codes cover a range of grades; months reflect cargo timing; Eurostat revises data. See scrap metal HS codes for what heading 7204 covers.
- Attribution: Source: Eurostat, Comext DS-045409, accessed 8 October 2026. Calculations by ScrapBasin; Eurostat does not endorse this analysis.
- Reuse: Eurostat data are reused under the Eurostat copyright notice (CC BY 4.0; Commission Decision 2011/833/EU), with the source acknowledged. All figures are as declared by the EU27. Eurostat's notice excludes commercial reuse of data for countries outside the EU, EFTA and the acceding and candidate countries; we treat EU-declared exports to such partners as EU data, but check the notice before reusing partner detail commercially.
This note updates monthly after each Comext release.
Get the Full Series
The ScrapBasin data note brings EU and UK export flows together with US scrap price indexes each month. The October 2026 sample issue is free.
Read the free October 2026 data note
ScrapBasin Pro includes the monthly data pack as CSV for USD 39 a month (three seats): see Plus and Pro.
Indicative information, not a price offer. ScrapBasin is an information service. It does not buy, sell or broker scrap.
Sources (checked 8 October 2026): Eurostat Comext DS-045409, https://ec.europa.eu/eurostat/web/international-trade-in-goods/database (Source: Eurostat, accessed 8 October 2026); Eurostat copyright notice, https://ec.europa.eu/eurostat/web/main/help/copyright-notice; Regulation (EU) 2024/1157, https://eur-lex.europa.eu/eli/reg/2024/1157/oj.
Public scrap price indexes for copper, brass, aluminium and steel each month, with the source on every figure.
Get Monthly Prices