Where Did UK Ferrous Scrap Go in the Last 12 Months?
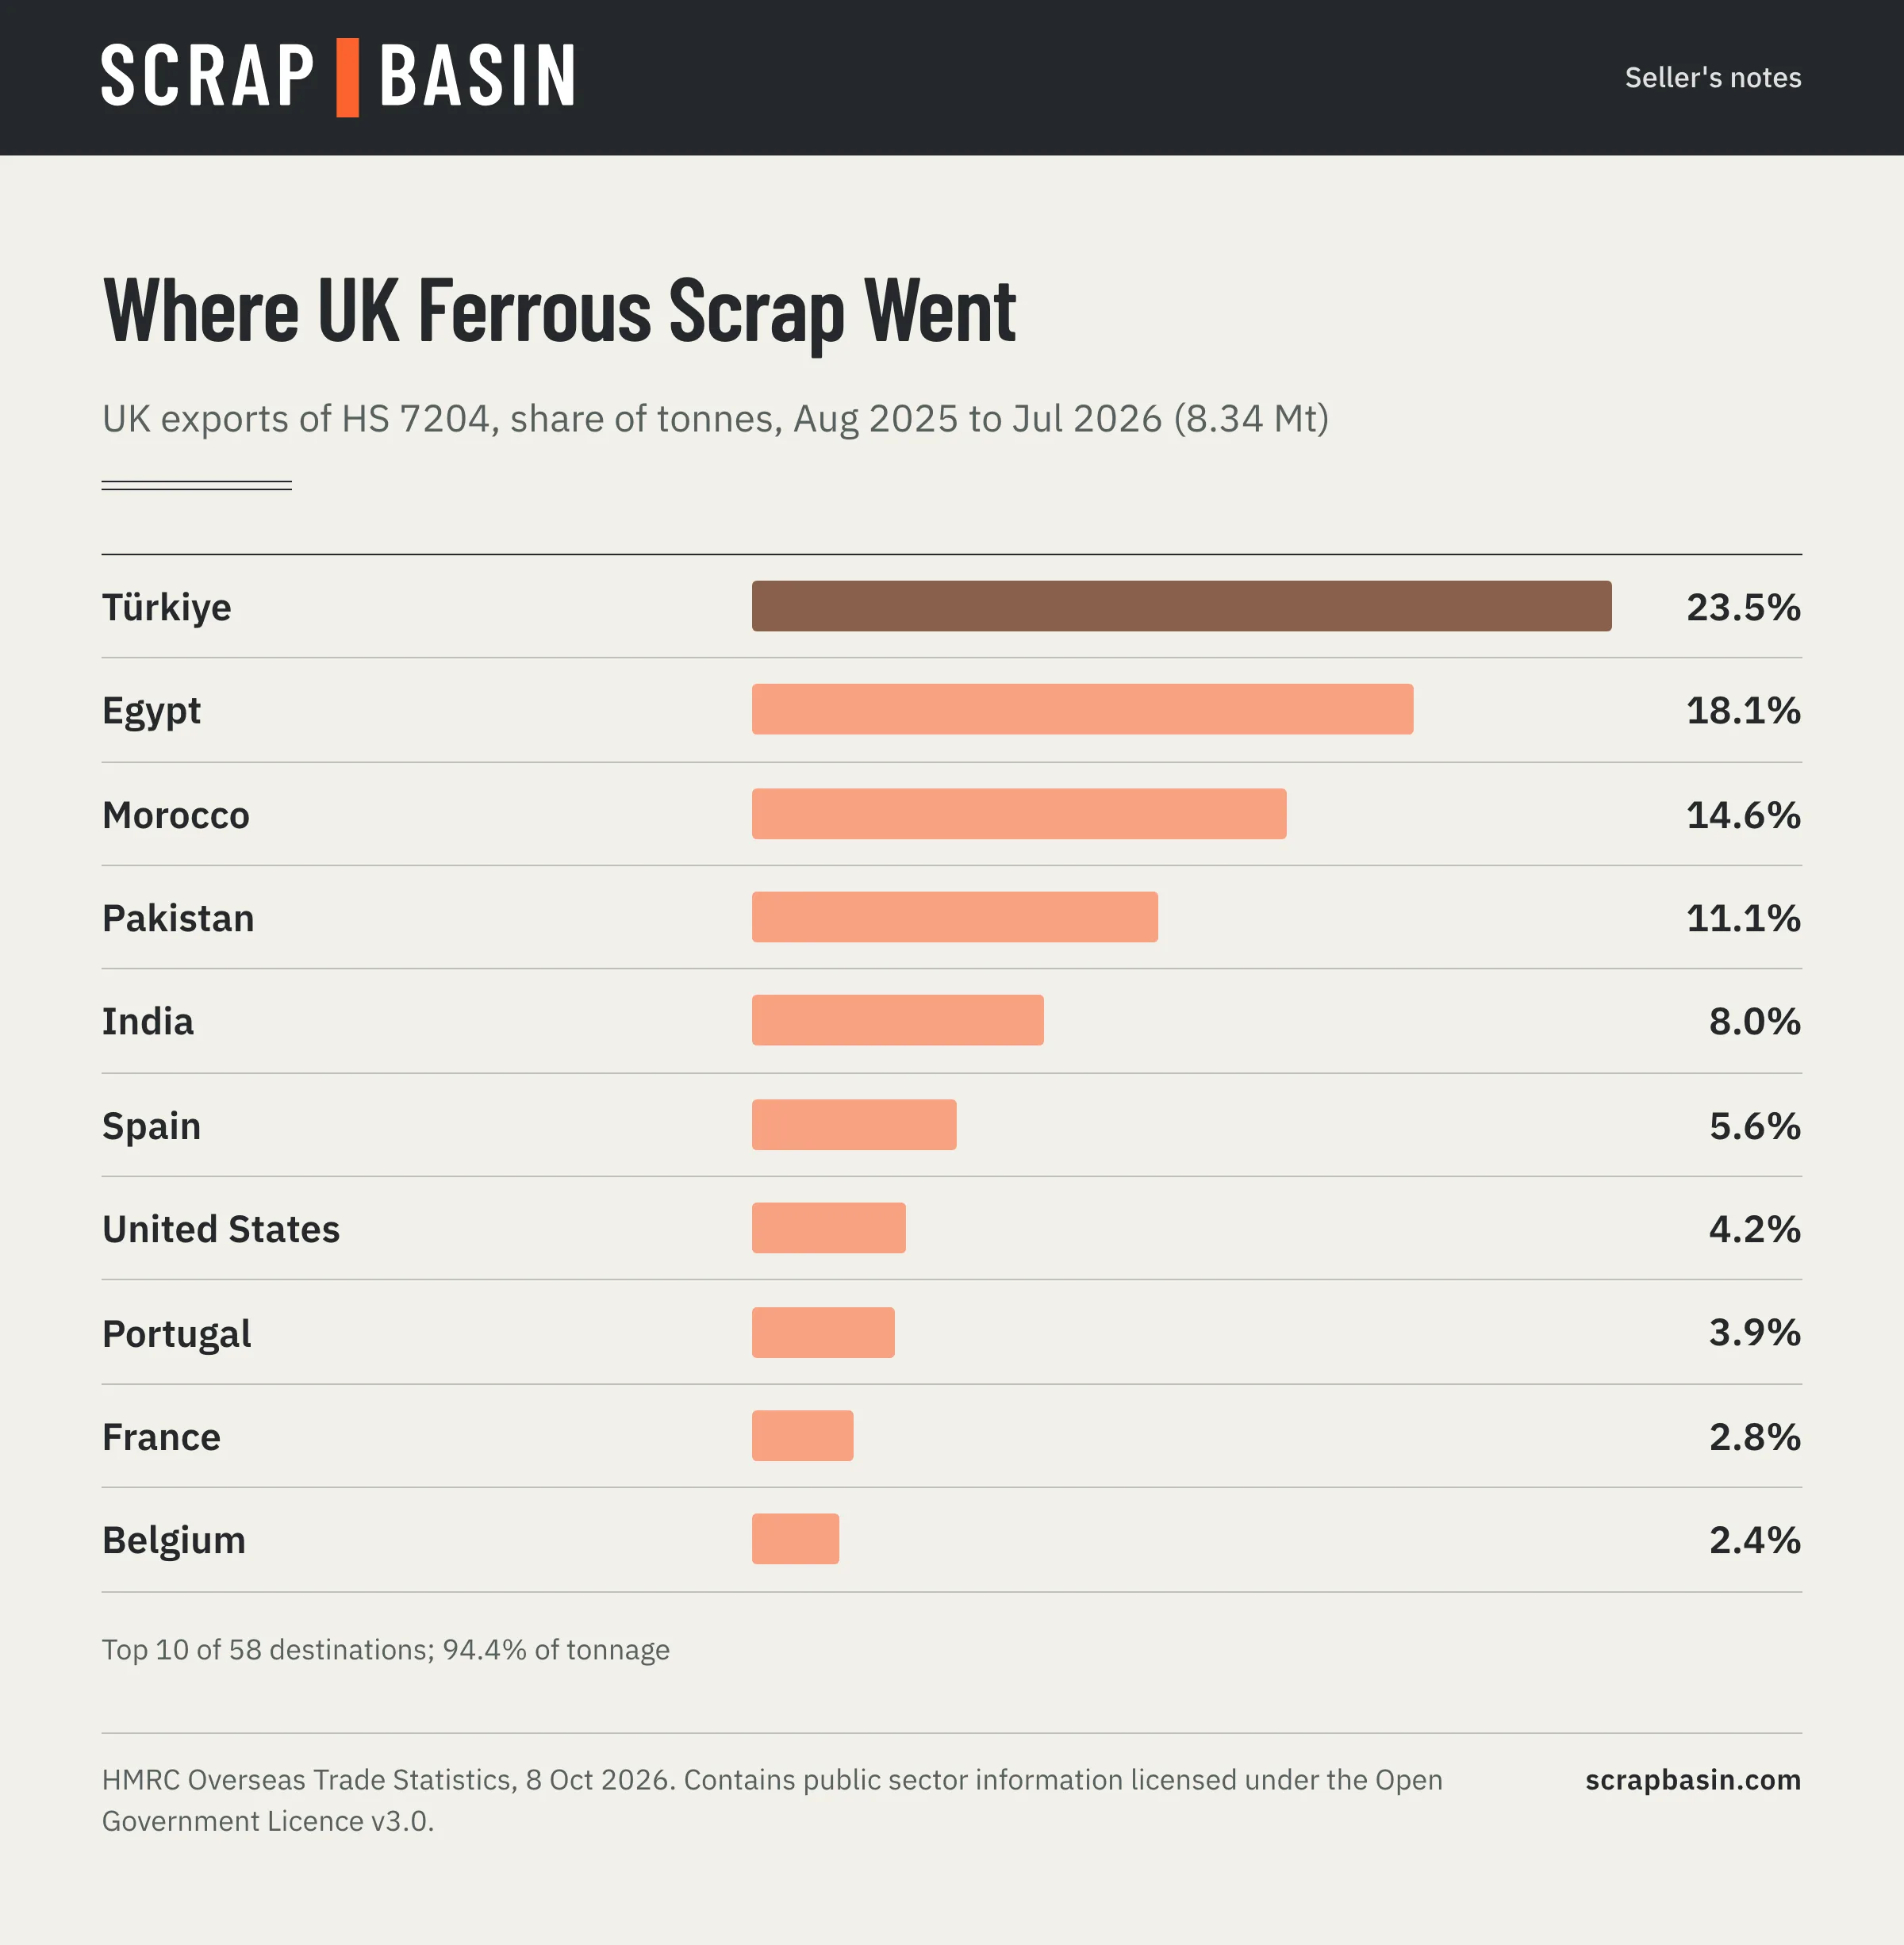
UK ferrous scrap exports by destination, Aug 2025 to Jul 2026, from HMRC data: 8.34 Mt, Türkiye 23.5%, Egypt and Morocco up by about a third.
Contents 7
If you sell, process or follow UK ferrous scrap, the export destinations tell you which buyers set the marginal price for UK material (the price paid for the last tonnes sold). This note uses HMRC's trade statistics, pulled on 8 October 2026, to show where UK exports of ferrous (iron and steel) waste and scrap (HS heading 7204, the customs heading for ferrous scrap) went in the twelve months to July 2026, how that compares with the year before, what products went where, and how volumes and declared values moved month by month. Every number below is computed from the HMRC extract; nothing is a licensed or assessed price.
In short
- UK exporters shipped 8.34 million tonnes of ferrous scrap between August 2025 and July 2026, 6.2% more than in the previous twelve months, with a declared value of GBP 2.43 billion.
- Türkiye remained the largest destination at 23.5%, down from 26.4%.
- Egypt (18.1%) and Morocco (14.6%) grew by about a third each. India fell 31.4% to 8.0%.
- Four destinations outside the OECD (the Organisation for Economic Co-operation and Development, a group of mostly high-income countries) (Egypt, Morocco, Pakistan and India) took 51.8% of UK ferrous scrap exports.
- The average declared value was GBP 291.5 per tonne, against GBP 296.4 a year earlier. It ranged from GBP 259 (August 2025) to GBP 328 (February 2026) across the year.
Destinations: The Top Ten
| Rank | Destination | Tonnes, Aug 2025 to Jul 2026 | Share | Share a year earlier | Change in tonnes |
|---|---|---|---|---|---|
| 1 | Türkiye | 1,962,722 | 23.5% | 26.4% | minus 5.4% |
| 2 | Egypt | 1,510,871 | 18.1% | 14.7% | +30.4% |
| 3 | Morocco | 1,219,028 | 14.6% | 11.6% | +33.3% |
| 4 | Pakistan | 924,247 | 11.1% | 10.6% | +10.8% |
| 5 | India | 668,678 | 8.0% | 12.4% | minus 31.4% |
| 6 | Spain | 470,114 | 5.6% | 7.7% | minus 22.0% |
| 7 | United States | 353,863 | 4.2% | 2.4% | +90.1% |
| 8 | Portugal | 323,002 | 3.9% | 4.4% | minus 5.7% |
| 9 | France | 233,683 | 2.8% | 1.8% | +61.7% |
| 10 | Belgium | 203,417 | 2.4% | 1.0% | +155.1% |
The market is concentrated: the top five destinations took 75.4% of tonnage and the top ten 94.4%, out of 58 destination countries in all. EU destinations took 17.7%, down from 19.1%.
What Changed
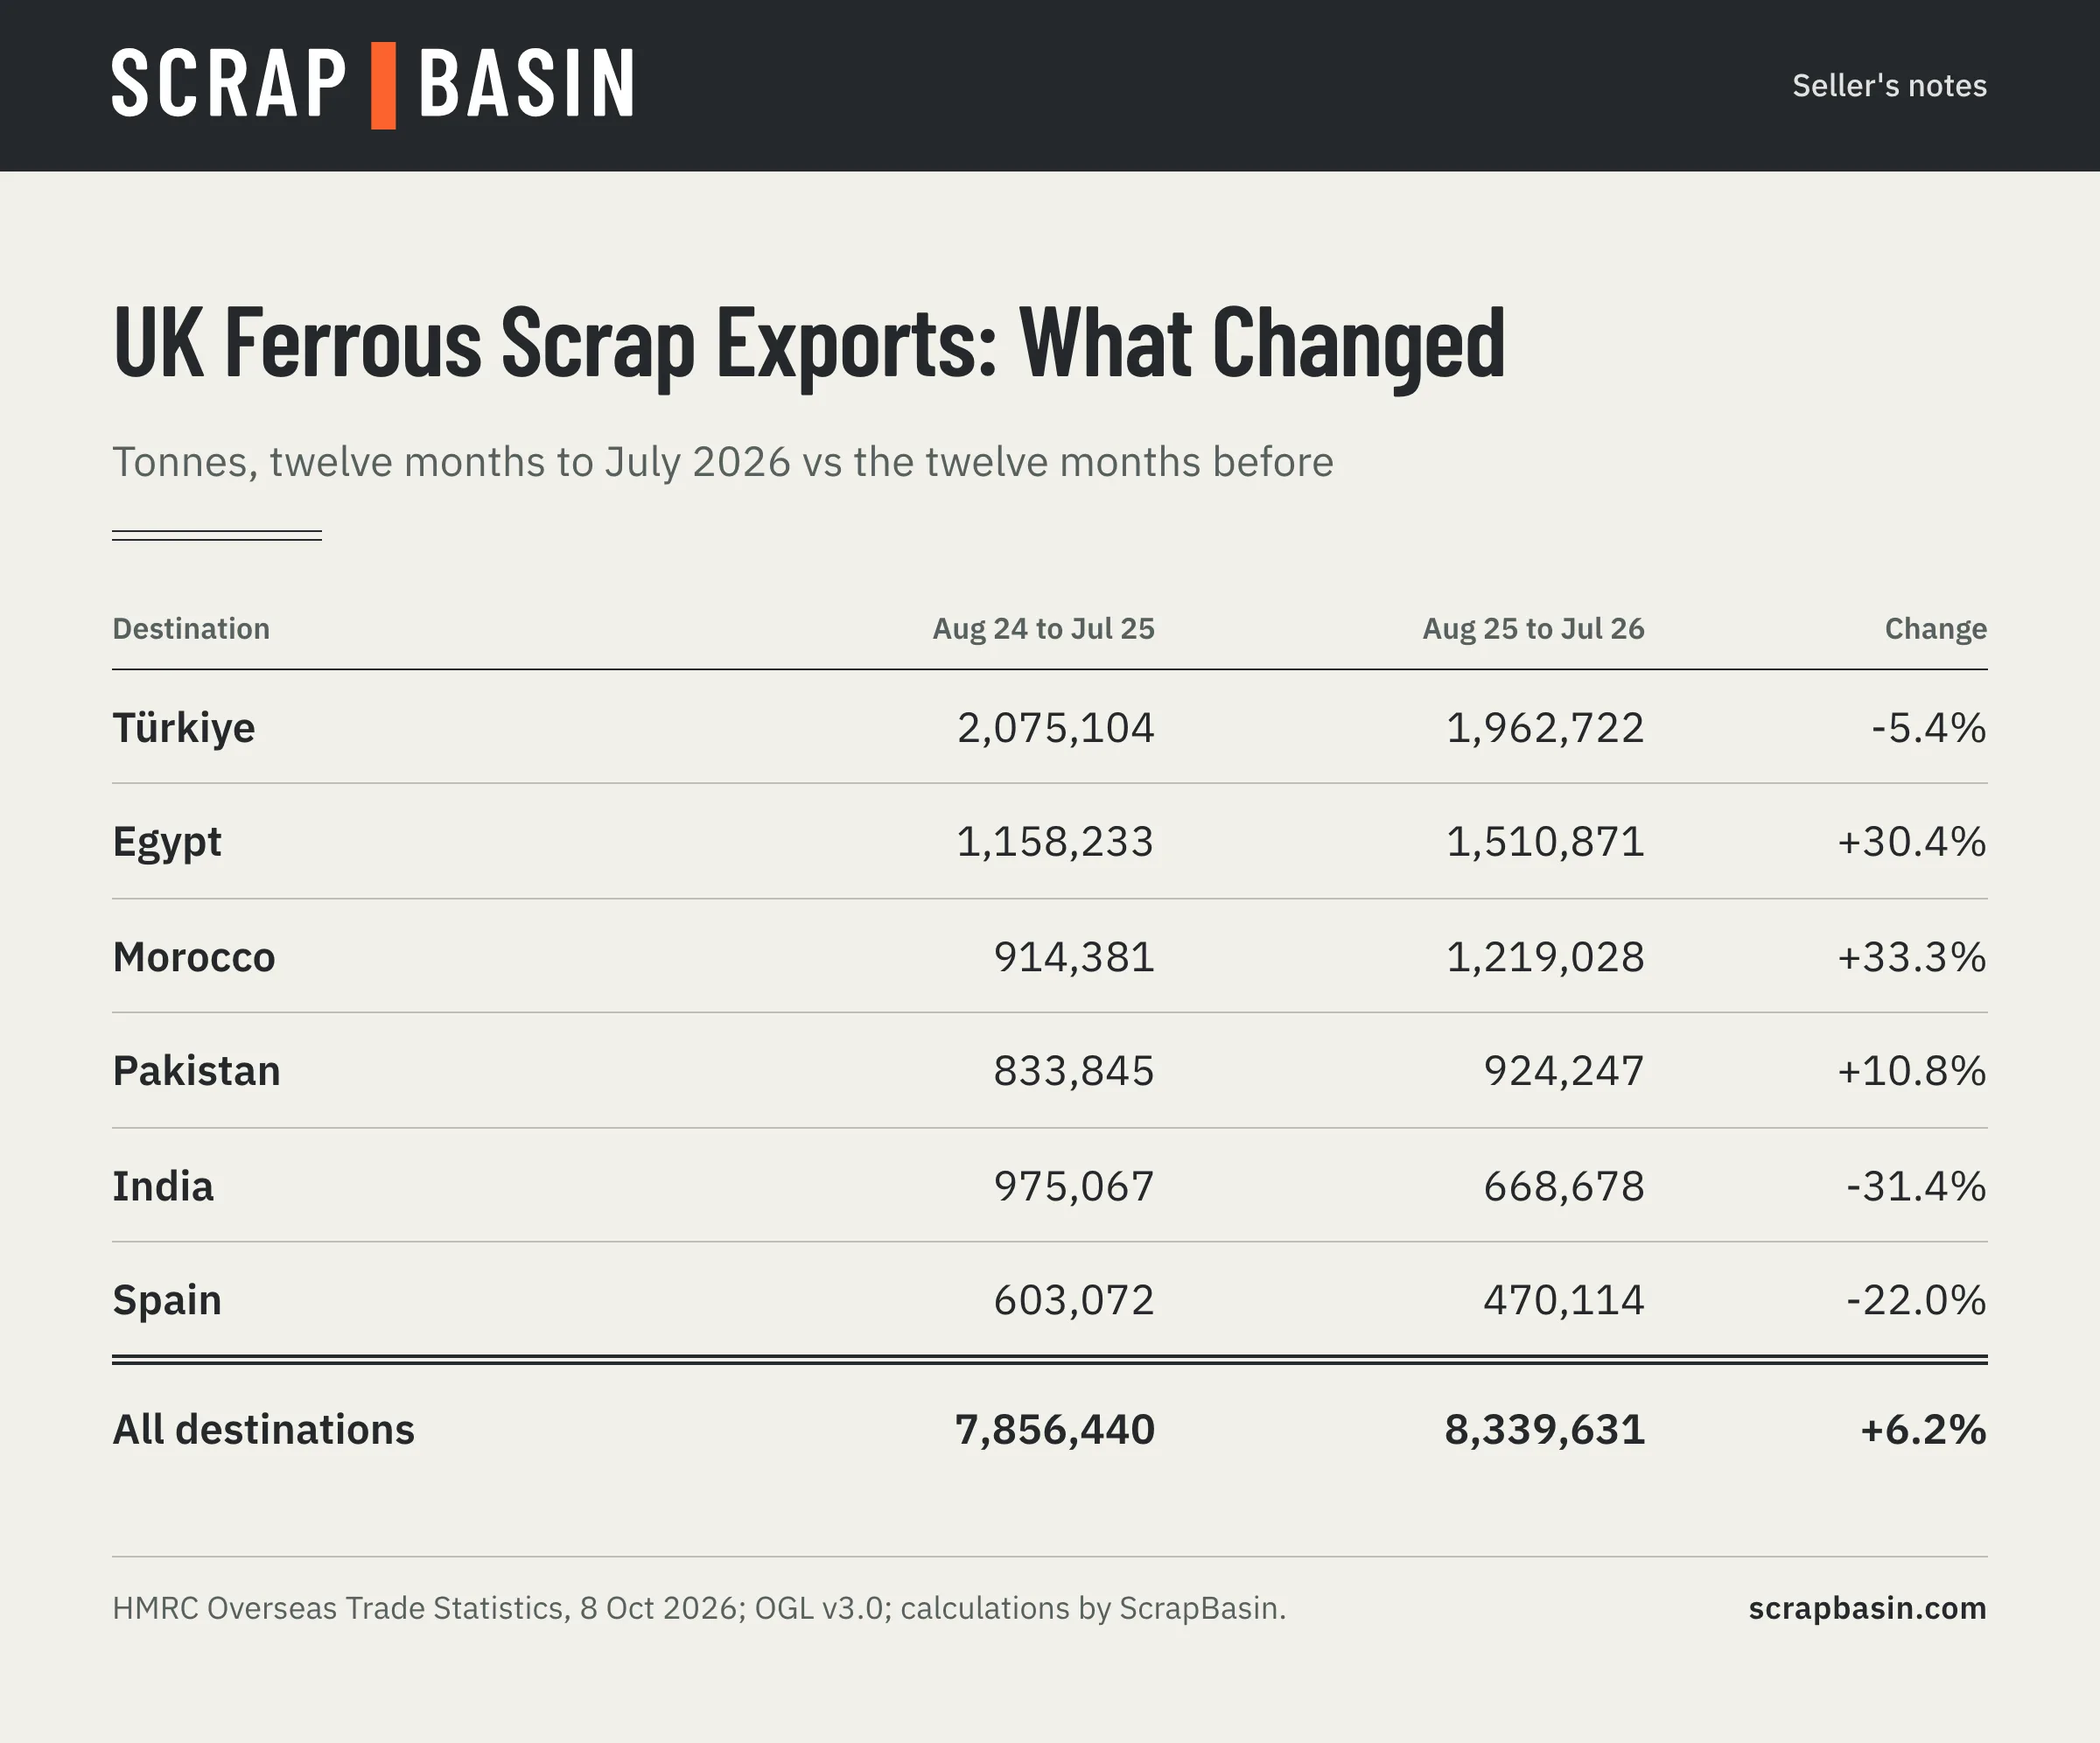
Three shifts stand out.
North Africa grew. Egypt and Morocco together took 2.73 million tonnes, up from 2.07 million. Between them they now take nearly a third of UK ferrous scrap exports (32.7%).
India fell back. Shipments to India dropped from 975,067 to 668,678 tonnes. India also takes a different product mix from most destinations (below), so this change matters more for some UK exporters than for others.
Türkiye held volume but lost share. Tonnage to Türkiye fell 5.4% while total exports rose, so its share fell by nearly three points.
Smaller destinations moved a lot in percentage terms, for example Belgium and the United States, but percentages on small bases can reflect a handful of cargoes.
What Went Where: Product Mix
HMRC splits heading 7204 into commodity codes. Over the twelve months, 53.7% of UK ferrous scrap exports by weight were "other" iron and steel scrap that is neither shredded nor bundled (7204 49 90), 29.7% were shredded (7204 49 10) and 5.0% were bundled (7204 49 30). Stainless, alloy, cast iron, turnings and other codes made up the rest. The mix differs sharply by destination:
| Destination | Shredded (7204 49 10) | Other, not shredded or bundled (7204 49 90) | Bundled (7204 49 30) | Other codes |
|---|---|---|---|---|
| Türkiye | 17.9% | 78.9% | 1.4% | 1.9% |
| Egypt | 11.1% | 88.9% | 0.0% | 0.0% |
| Morocco | 31.1% | 60.2% | 6.0% | 2.7% |
| Pakistan | 67.1% | 11.5% | 5.2% | 16.2% |
| India | 46.1% | 17.2% | 6.8% | 29.9% |
| United States | 3.4% | 4.2% | 43.7% | 48.7% |
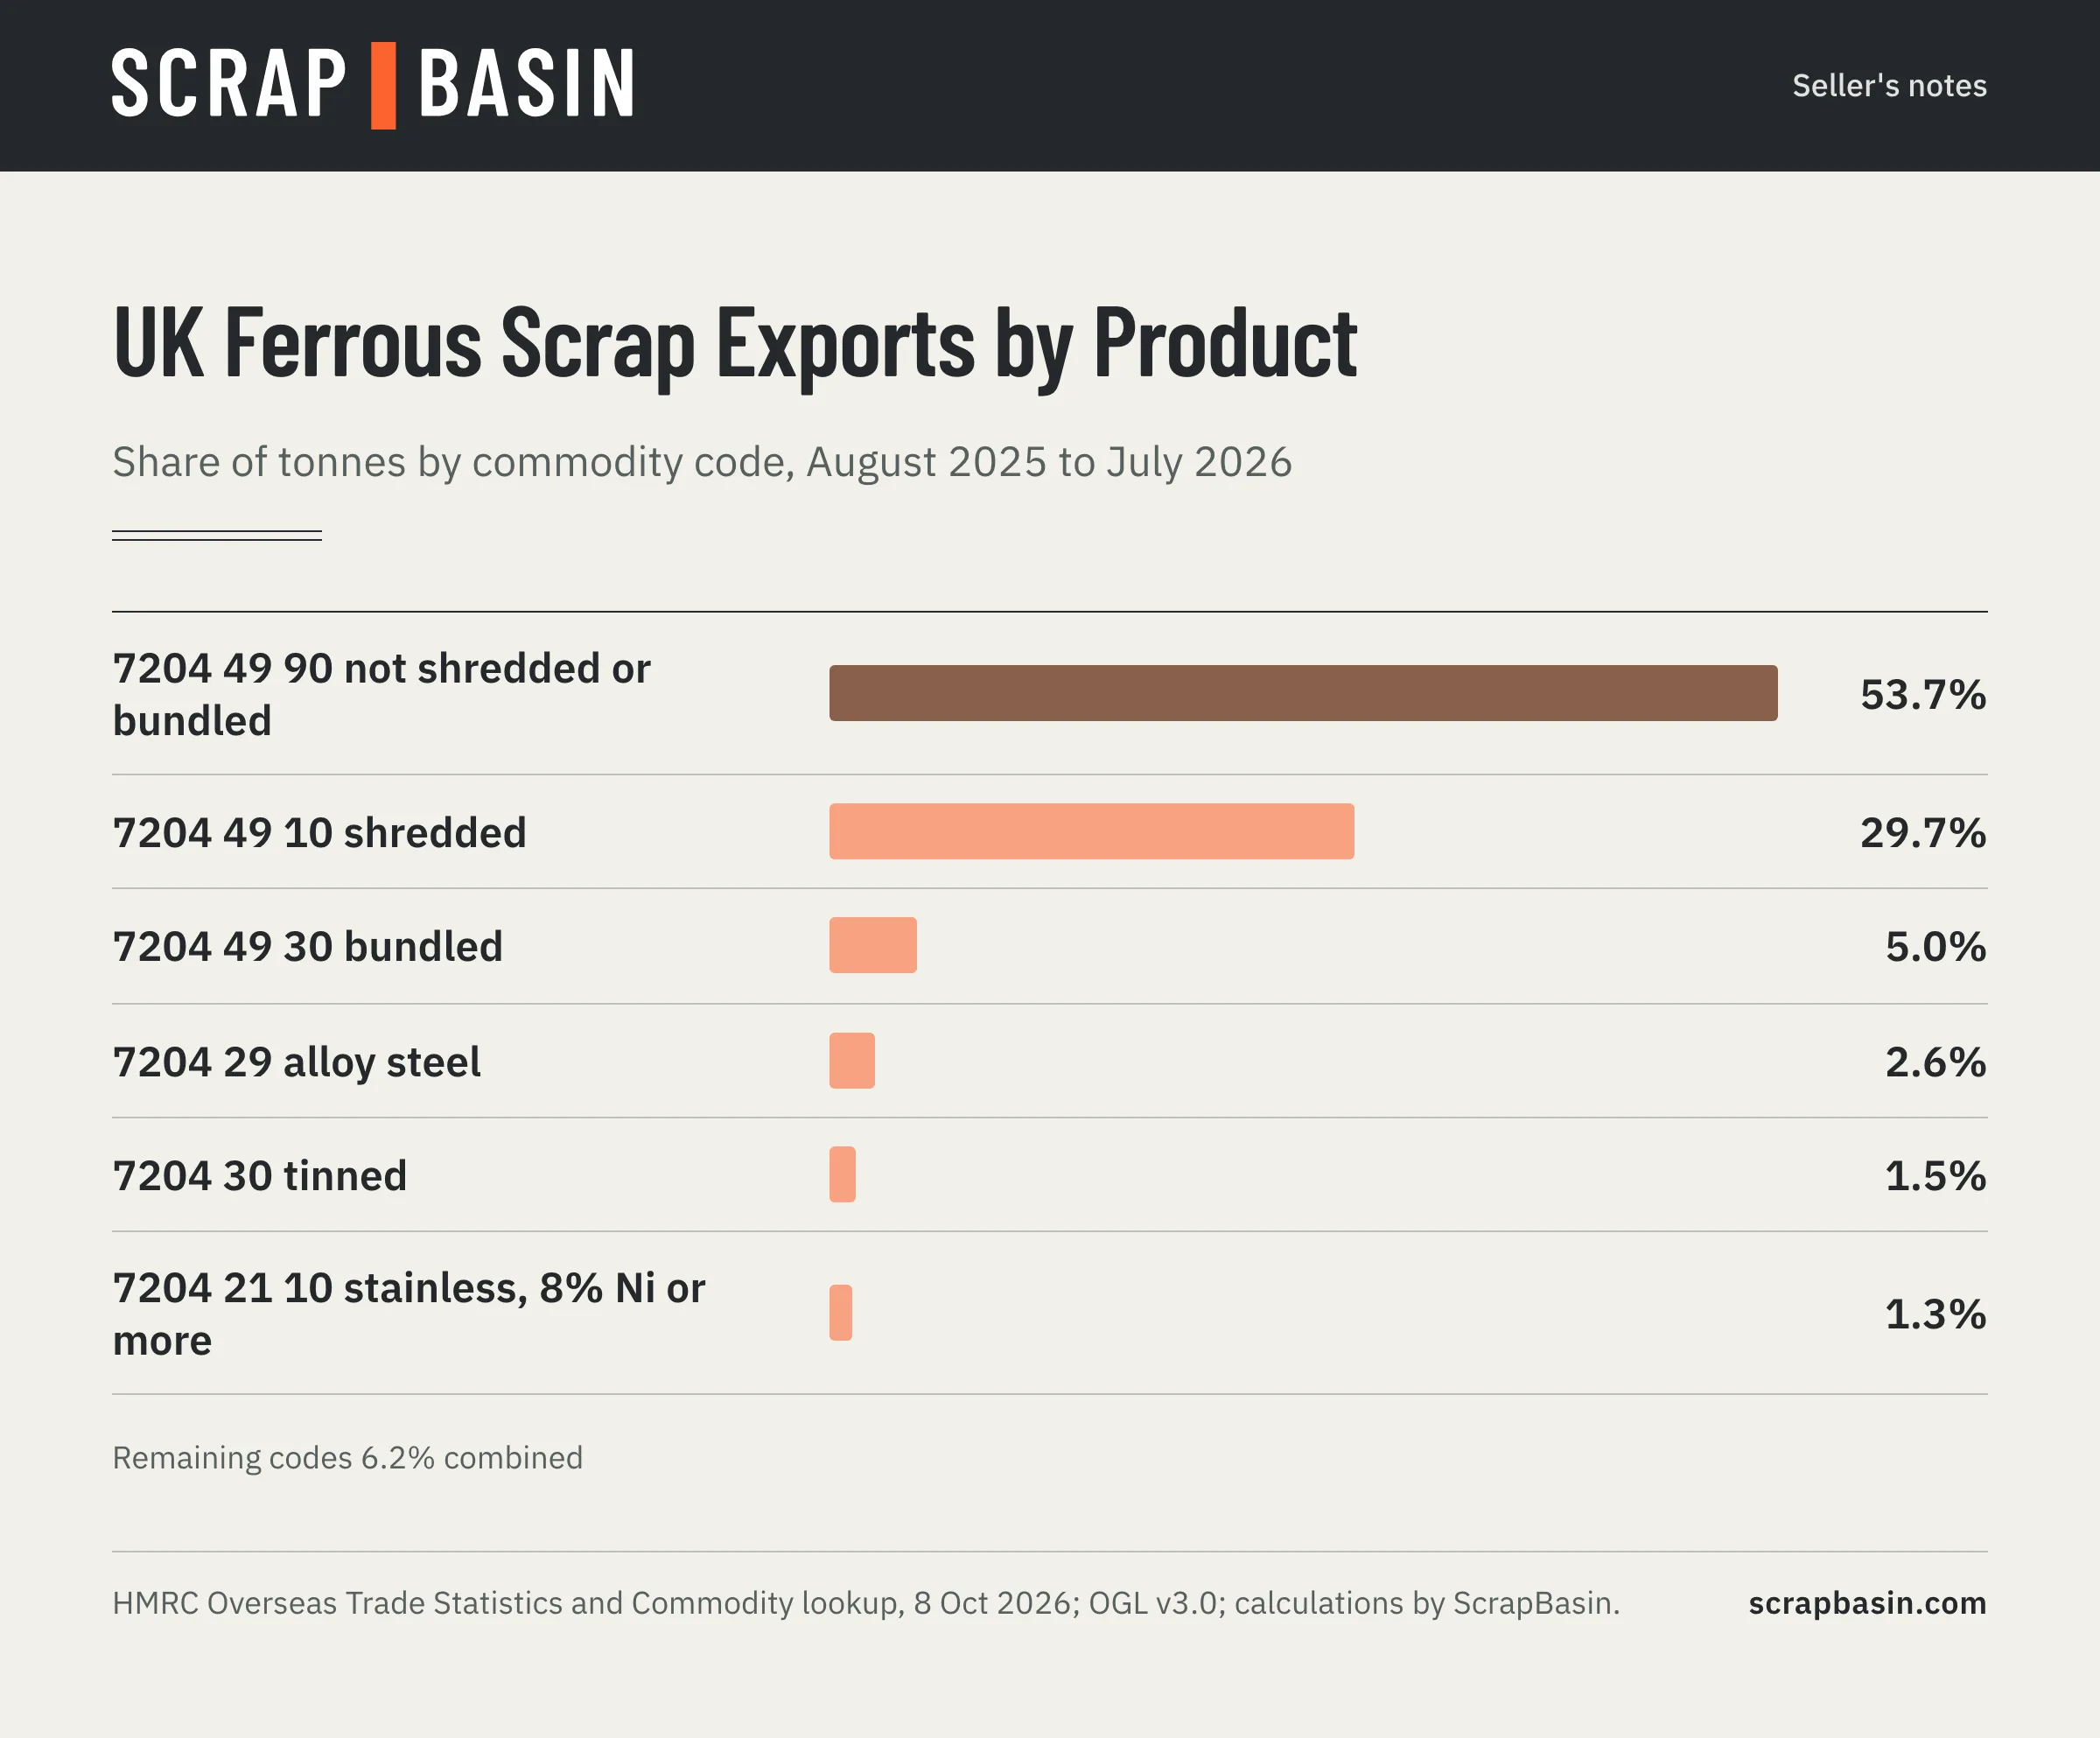
Pakistan and India take mostly shredded scrap and other specialised codes; Türkiye and Egypt take mostly scrap declared as neither shredded nor bundled (7204 49 90), the code where loose heavy melting grades usually sit. The United States takes bundles and other codes, not the bulk heavy grades. A change in demand from one destination therefore falls on particular UK processors and grades, not on "UK scrap" in general. Our scrap metal HS codes guide explains each code.
Month by Month
Monthly exports ranged from 443,606 tonnes (January 2026) to 904,108 tonnes (May 2026). The average declared value moved from GBP 259 per tonne in August 2025, the low point of the period, to GBP 328 in February 2026, and stood at GBP 305 in July 2026.
Declared value per tonne is total value divided by net mass for the heading. It moves with product mix, contract timing and the freight terms on which goods are declared, so it is a broad indicator of direction, not a price. See scrap metal prices explained for what a price contains.
What to Watch
The EU's new rules on exports of green-listed waste to non-OECD countries apply from 21 May 2027 (see the EU Waste Shipment Regulation). They govern shipments from the EU, not from the UK. Egypt, Morocco, Pakistan and India are large buyers of both UK and EU ferrous scrap (compare our note on EU27 ferrous scrap exports). Whether EU restrictions change competition for UK-origin scrap in those markets is a question this series will track; we make no forecast.
Method and Reuse
- Source: HMRC Overseas Trade Statistics via the uktradeinfo OData API, queried 8 October 2026 without a key. Flows: EU exports and non-EU exports (FlowTypeId 2 and 4). Commodities: all CN8 codes under heading 7204. Months: August 2024 to July 2026 (July 2026 is the latest month published at the time of the pull).
- Processing: rows aggregated by month, destination and commodity; net mass converted from kilograms to tonnes; unit value = value / net mass. We publish the exact query and the extract with the note so the figures can be re-run.
- Limits: suppressed or confidential trade is not separately identified; small destinations can swing on single cargoes; HMRC revises data.
- Licence: Contains public sector information licensed under the Open Government Licence v3.0. Calculations by ScrapBasin.
This note updates monthly after each HMRC release.
Get the Full Series
The ScrapBasin data note brings this series together with US scrap price indexes and UK copper and aluminium export values each month. The October 2026 sample issue is free.
Read the free October 2026 data note
ScrapBasin Pro includes the monthly data pack as CSV, with destination and commodity detail, for USD 39 a month (three seats): see Plus and Pro.
Indicative information, not a price offer. ScrapBasin is an information service. It does not buy, sell or broker scrap.
Sources (checked 8 October 2026): HMRC Overseas Trade Statistics API, https://api.uktradeinfo.com/OTS; API documentation, https://www.uktradeinfo.com/api-documentation/; Open Government Licence v3.0, https://www.nationalarchives.gov.uk/doc/open-government-licence/version/3/.
Public scrap price indexes for copper, brass, aluminium and steel each month, with the source on every figure.
Get Monthly Prices