UK Copper Scrap Exports by Destination: Why Do China and India Values Differ?
UK copper scrap exports, Aug 2025 to Jul 2026, from HMRC data: 261,833 t, China 41.7%, India 16.5%, and why unit values differ two to one by destination.
Contents 5
Copper scrap carries far more value per tonne than the bulk ferrous trade: on UK export declarations it averaged GBP 6,463 a tonne over the twelve months to July 2026, against GBP 291.5 for ferrous scrap. This note uses HMRC's trade statistics, pulled on 8 October 2026, to show where UK exports of copper waste and scrap (HS heading 7404, the customs heading for copper scrap) went in the twelve months to July 2026, how tonnage and declared value changed, and what the data says about value by destination. It also shows the limits of customs data, using a gap in the figures that no single copper price could explain.
In short
- UK exporters shipped 261,833 tonnes of copper waste and scrap between August 2025 and July 2026, 2.3% more than a year earlier. Declared value rose 22.6% to GBP 1.69 billion.
- The average declared value was GBP 6,463 per tonne, up 19.8%. In July 2026 alone it reached GBP 7,656, the highest in the 24 months we pulled.
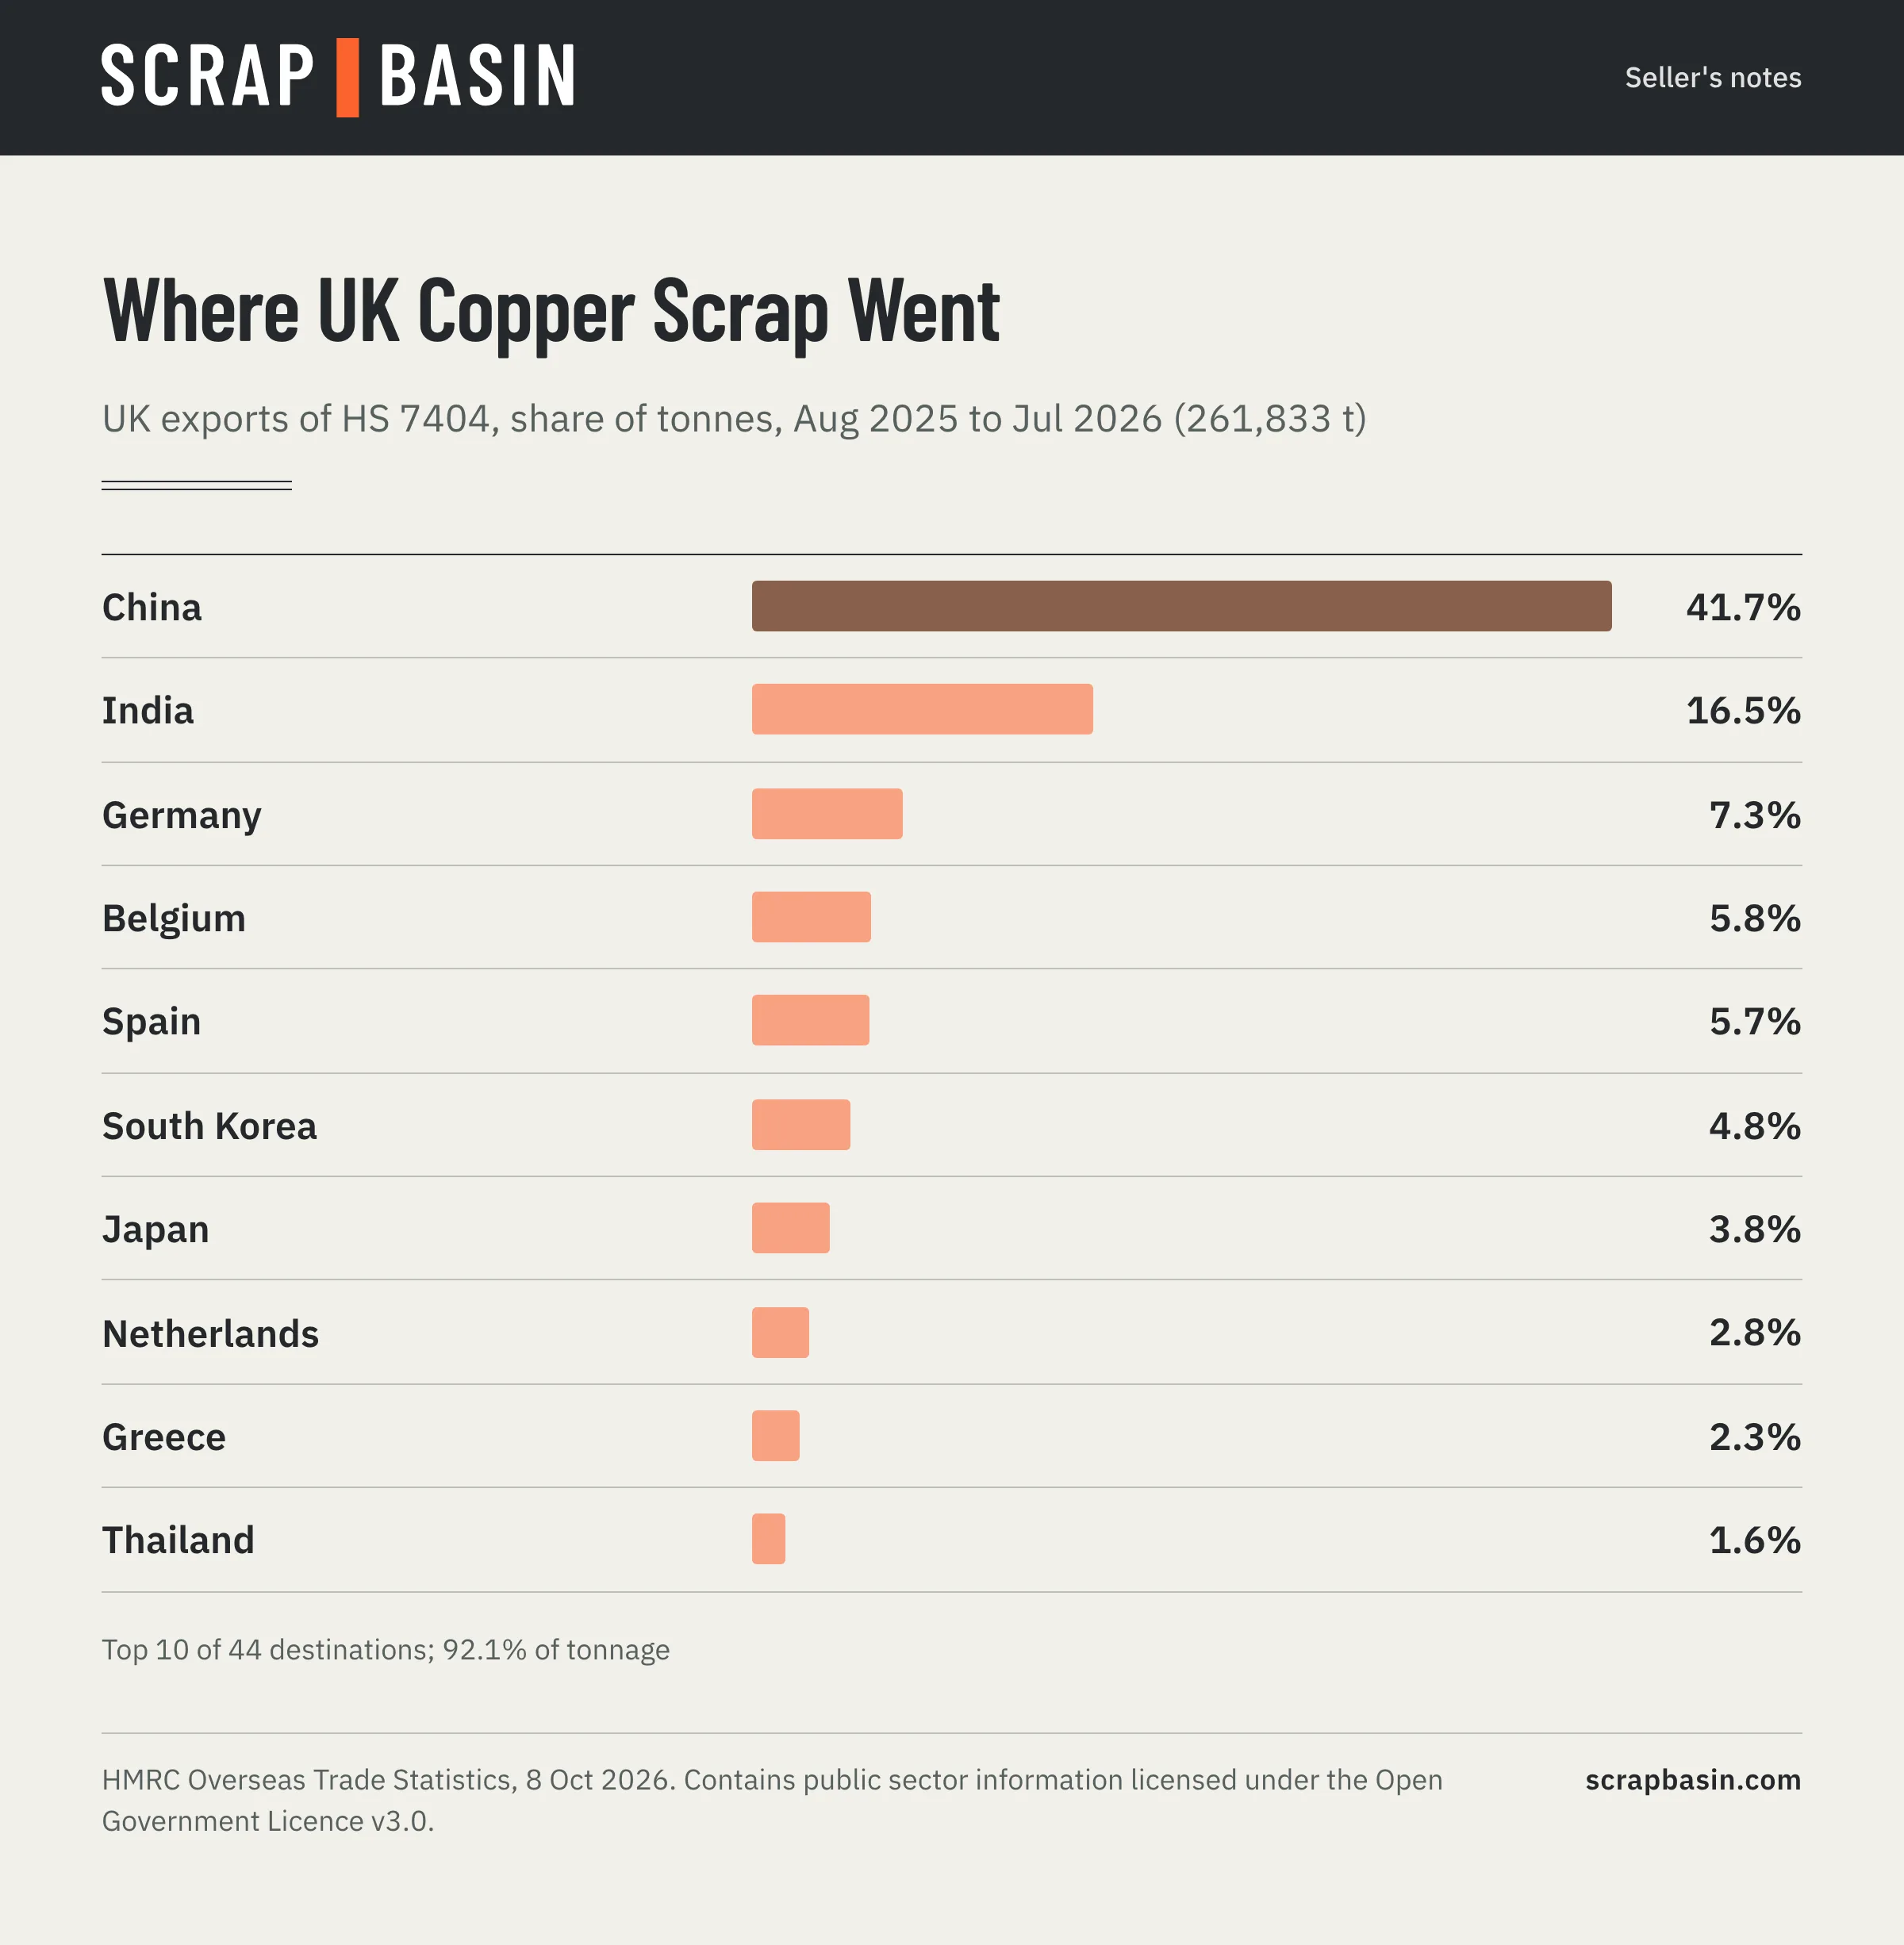
- China took 41.7% of tonnage (up from 36.2%), India 16.5%, and EU destinations together 26.7%.
- Refined copper scrap (7404 00 10) was 54.1% of tonnage, other copper alloys 30.1% and brass 15.9%.
- The same code, refined copper scrap, averaged GBP 7,458 per tonne to China and GBP 3,705 to India. That gap is a warning about reading customs values as prices.
Destinations
| Rank | Destination | Tonnes | Share | Share a year earlier | Change in tonnes | Declared GBP per tonne |
|---|---|---|---|---|---|---|
| 1 | China | 109,203 | 41.7% | 36.2% | +17.9% | 7,569 |
| 2 | India | 43,292 | 16.5% | 15.6% | +8.4% | 4,102 |
| 3 | Germany | 19,174 | 7.3% | 6.7% | +11.4% | 6,444 |
| 4 | Belgium | 15,151 | 5.8% | 7.3% | minus 18.4% | 5,995 |
| 5 | Spain | 14,794 | 5.7% | 5.0% | +14.9% | 5,701 |
| 6 | South Korea | 12,466 | 4.8% | 3.6% | +36.3% | 7,910 |
| 7 | Japan | 9,869 | 3.8% | 6.1% | minus 36.9% | 6,337 |
| 8 | Netherlands | 7,248 | 2.8% | 1.0% | +192.4% | 4,696 |
| 9 | Greece | 5,954 | 2.3% | 2.1% | +8.4% | 7,839 |
| 10 | Thailand | 4,091 | 1.6% | 2.9% | minus 45.4% | 3,609 |
The top five destinations took 77.0% of tonnage and the top ten 92.1%, out of 44 destinations. China's share rose by 5.5 points; Japan and Thailand lost ground.
Value Rose Much Faster than Volume
Tonnage was almost flat (+2.3%) while declared value rose 22.6%, so nearly all the increase in value came from a higher value per tonne. Month by month, the average climbed from GBP 5,402 per tonne in October 2025, the low point of the twelve months, to GBP 7,656 in July 2026, 43.0% above July 2025.
That is consistent with the wider copper market. The US producer price index for No. 1 copper scrap was 41.2% higher in August 2026 than a year earlier (preliminary). Our guide to how copper scrap prices are set explains how a refined copper move passes through to scrap.
Value by Destination, and Why It Is Not a Price
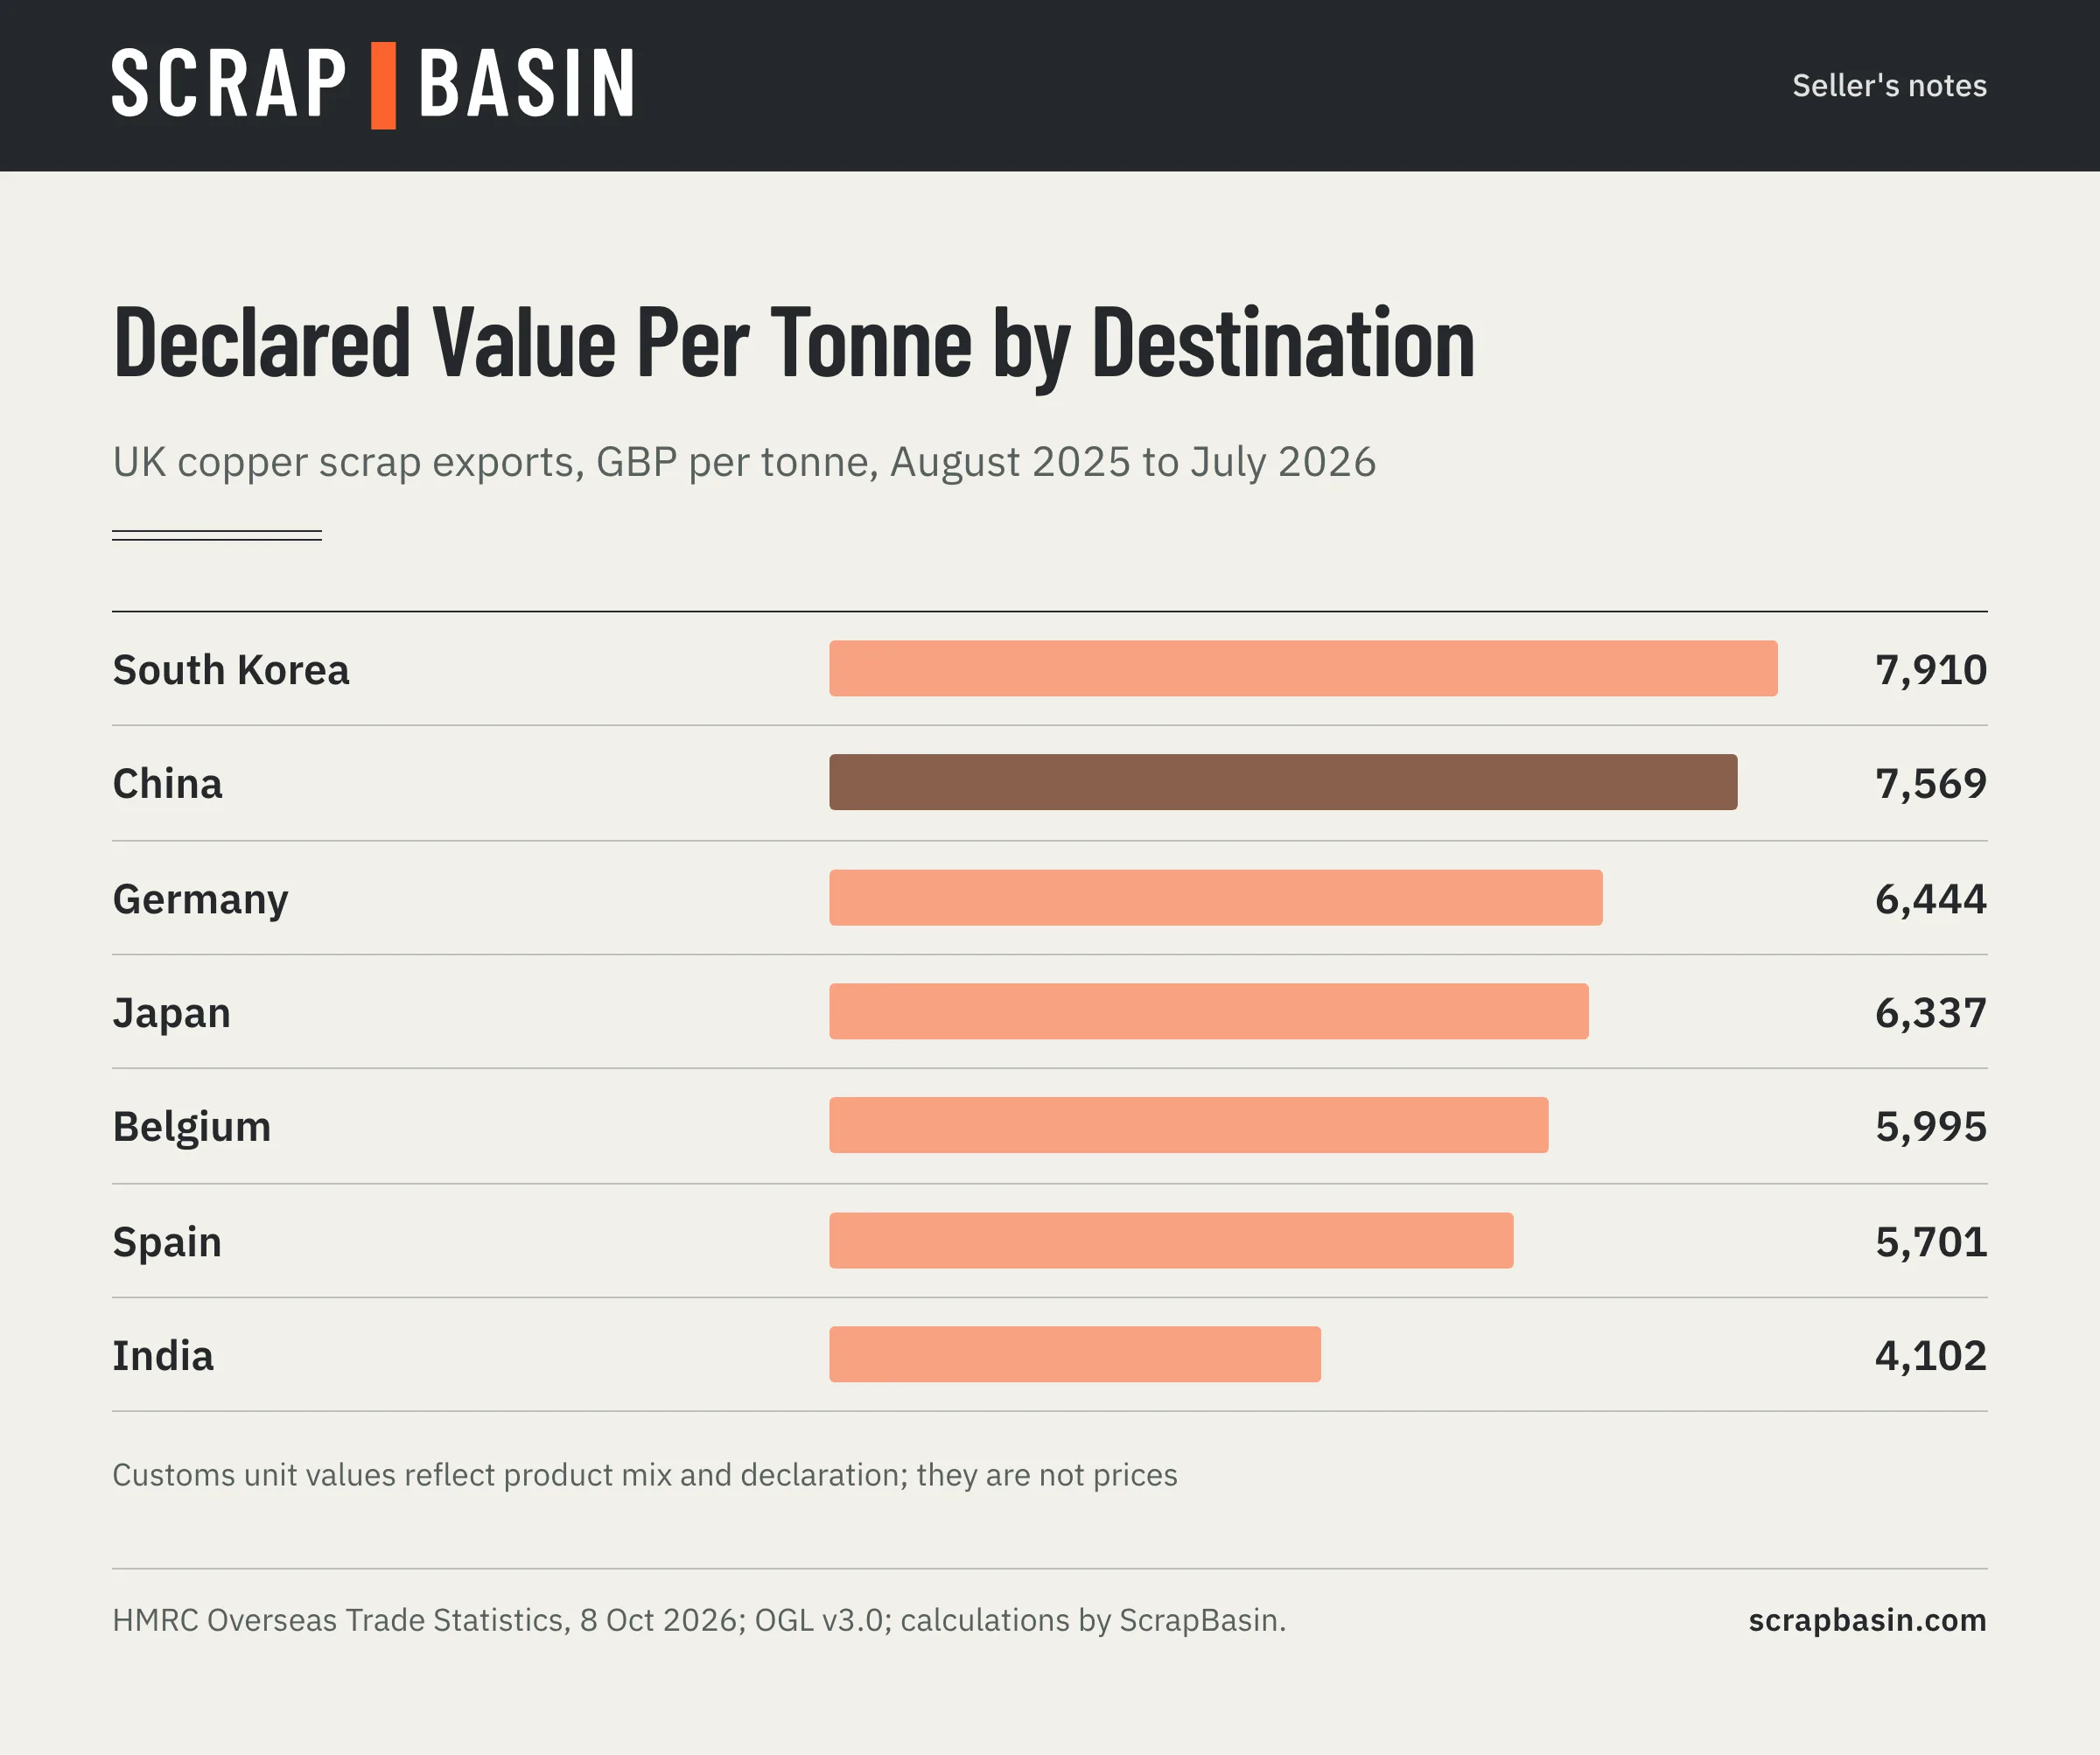
Declared value per tonne ranges from GBP 7,910 for South Korea to GBP 4,102 for India. Part of that is product mix: brass and copper alloys are worth less per tonne than refined copper scrap, and destinations take different mixes.
| Destination | Refined copper scrap (7404 00 10) | Brass (7404 00 91) | Other copper alloys (7404 00 99) |
|---|---|---|---|
| China | 62.3% of tonnes, GBP 7,458/t | 10.5%, GBP 6,939/t | 27.2%, GBP 8,067/t |
| India | 49.6%, GBP 3,705/t | 24.2%, GBP 5,296/t | 26.2%, GBP 3,748/t |
| Germany | 19.5%, GBP 8,800/t | 40.0%, GBP 5,885/t | 40.5%, GBP 5,858/t |
But mix does not explain everything. Within the single code for refined copper scrap, shipments to China averaged GBP 7,458 per tonne and shipments to India GBP 3,705. No price for one grade of copper scrap could support a two-to-one gap within the same year. The likely explanation is that different material was declared under the same code, for example lower-grade or copper-bearing material alongside clean refined scrap, or that values were declared on a different basis. Either way, it shows what customs data is: a record of what exporters declared, aggregated. It is excellent for volumes and direction, and a poor guide to what any one grade is worth.
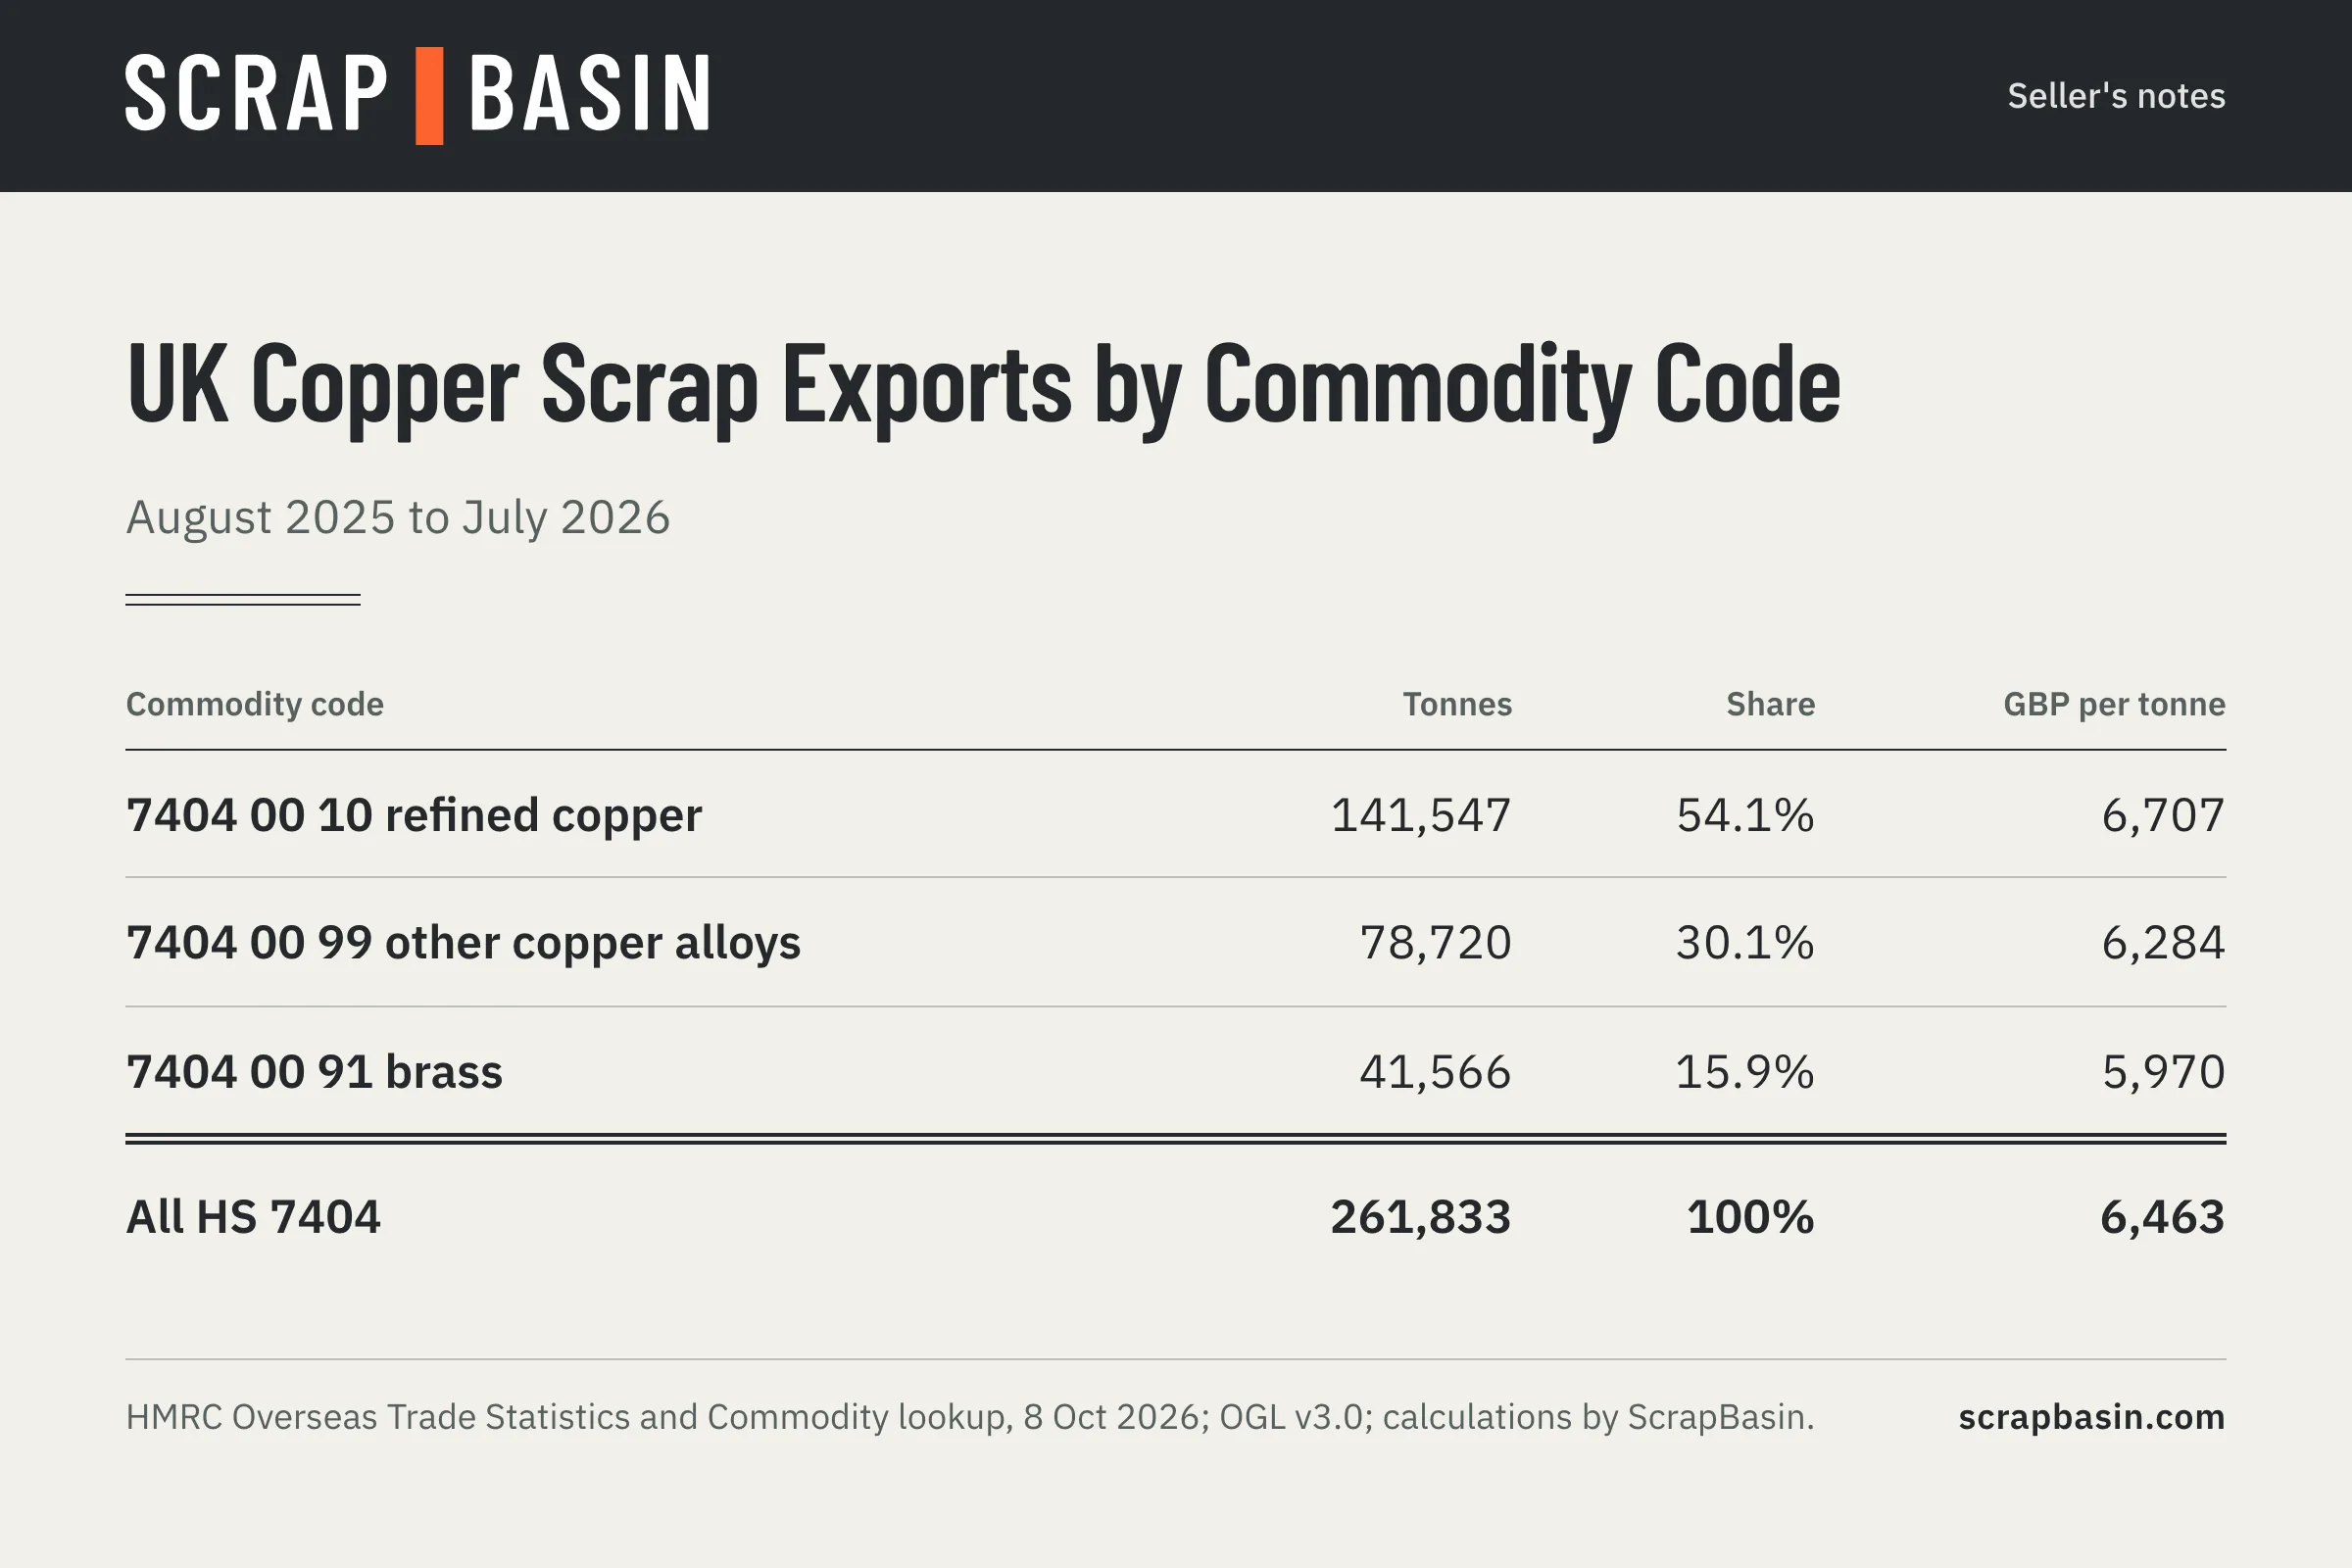
Across all destinations, refined copper scrap averaged GBP 6,707 per tonne, other copper alloys GBP 6,284 and brass GBP 5,970. Brass averaged 89% of the refined copper figure; our brass scrap grades guide explains why brass follows copper but sits below it. The scrap metal HS codes guide sets out what each code covers.
Method and Reuse
- Source: HMRC Overseas Trade Statistics via the uktradeinfo OData API, queried 8 October 2026 without a key. Flows: EU and non-EU exports. Commodities: CN8 codes under heading 7404. Months: August 2024 to July 2026 (July 2026 latest available).
- Processing: rows aggregated by month, destination and code; net mass converted to tonnes; unit value = declared value / net mass. We publish the exact query and the extract with the note.
- Limits: declared values reflect contract timing, delivery terms and declaration practice; suppressed trade is not separately identified; HMRC revises data.
- Licence: Contains public sector information licensed under the Open Government Licence v3.0. Calculations by ScrapBasin.
The ferrous companion to this note is UK ferrous scrap exports. Both update monthly after each HMRC release.
Get the Full Series
The October 2026 data note sets these UK export values alongside US scrap price indexes by grade, with sources and methods on every chart. The sample issue is free.
Read the free October 2026 data note
ScrapBasin Pro includes the monthly data pack as CSV for USD 39 a month (three seats): see Plus and Pro.
Indicative information, not a price offer. ScrapBasin is an information service. It does not buy, sell or broker scrap.
Sources (checked 8 October 2026): HMRC Overseas Trade Statistics API, https://api.uktradeinfo.com/OTS (contains public sector information licensed under the Open Government Licence v3.0); API documentation, https://www.uktradeinfo.com/api-documentation/; U.S. Bureau of Labor Statistics PPI WPU10230101 via FRED, https://fred.stlouisfed.org/series/WPU10230101.
Public scrap price indexes for copper, brass, aluminium and steel each month, with the source on every figure.
Get Monthly Prices